
Tinnitus was considered present if a participant answered positive to In the past twelve months have you been bothered by ringing roaring or buzzing in your ears or head that lasts for five ID: 784560
Download The PPT/PDF document "Demographic and Survey data" is the property of its rightful owner. Permission is granted to download and print the materials on this web site for personal, non-commercial use only, and to display it on your personal computer provided you do not modify the materials and that you retain all copyright notices contained in the materials. By downloading content from our website, you accept the terms of this agreement.


Slide1
Demographic and Survey dataTinnitus was considered present if a participant answered positive to: In the past twelve months, have you been bothered by ringing, roaring, or buzzing in your ears or head that lasts for five minutes or more? Sex of the participants was categorized as male and female.Socioeconomic status: low (PIR≤1.3), mid (PIR: 1.4-3.5) and high (PIR > 3.5). Age of participants was categorized in four subgroups: 12-13 years, 14-15 years, 16-17 years, and 18-19 years.Race/ethnicity was re-coded into non-Hispanic white, non-Hispanic black, Hispanic and other races (including multiracial).Firearms noise exposure was considered positive if a participant answered positively to the question: Have you ever used firearms for target shooting, hunting, or for any other purposes? Work-related noise exposure was defined as positive if a participant answered positively to the question: Have you ever had a job where you were exposed to loud noise for five or more hours a week? Music exposure was defined as positive if a participant identified exposure to loud noise or music for five or more hours per week outside of a job. History of smoking was considered positive if a participant answered positively to any of the following questions: Have you ever tried smoking? or Does anyone smoke at home?
METHODSAudiometric testing was performed by NHANES (2005-10). Data was collected through household interviews followed by a standardized physical examination. Demographic and audiometric databases from NHANES 2005-06, 07-08 and 09-10 were merged.Individuals ranging in age from 12-19 years with bilateral normal otoscopic findings, compliance value ranges from 0.2 to 1.8 cc, and middle ear pressure ranging from -50 to 25 dapa in both ears were considered for further analysis. (Total: 2348 participants) Audiometric Measures Interacoustic model AD226 audiometer with standard TDH-39 headphones were used to measure hearing sensitivity. Testing was conducted according to a modified Hughson Westlake procedure using automatic testing mode.Definition of Audiometric Notch A drop in hearing sensitivity at 4 to 6 kHz of at least 15 dB from the self-referenced previous best threshold in a linear progression of frequencies, with a recovery of at least 5 dB after the notch.
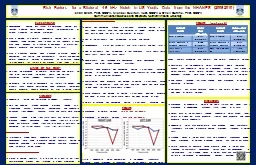
Risk Factors for a Bilateral 4-6 kHz Notch in US Youth: Data from the NHANES (2005-2010)Ishan Bhatt, PhD, CCC-A, Michael Skelton, AuD, CCC-A & O’neil Guthrie, PhD, CCC-ACommunication Sciences and Disorders, Northern Arizona University
BACKGROUNDNoise-induced hearing loss (NIHL) is a permanent hearing loss that remains a hearing health concern despite the implementation of national standards for hearing protection.NIHL is defined as a bilateral audiometric hearing loss at the frequency range between 3000 to 6000 Hz with recovery at 8000 Hz. NIHL slowly develops as a function of continuous or intermittent acoustic exposure and duration (Kirchner et al, 2012).NIHL is a complex disorder which is caused by multiple genes in combination with lifestyle and environmental factors. We identified bilateral audiometric notches at 4000-6000 Hz as an NIHL phenotype to study genetic risk factors in our previous study (Phillips et al., 2015).
RESULTS (continued)Tables: Factors associated with unilateral and bilateral audiometric notchesRisk-factors for the audiometric notch: Multinomial logistic regression analysis with audiometric notch as a dependent variable (with 3 levels: no notch, unilateral notch, bilateral notches) and with above listed factors as dependent variables were used to identify the risk-factors of the notch. The analysis revealed that males showed lower prevalence of notches compared to females. Participants with African American ancestry and history of noisy job revealed high odds of bilateral notches.Unilateral notch was associated with age range of 14-15 years, and African American ancestry.
AIMES OF THE STUDY
To
study the prevalence of unilateral notch (UN) and bilateral notch (BN) in US youth using the National Health And Nutrition Examination Survey (NHANES 2005-2010) database.To evaluate the effect of non-genetic risk factors (i.e. gender, age, ethnicity, family income, work-related noise exposure, recreational acoustic exposure, acoustic exposure just prior to testing, firearm noise exposure, tinnitus and ear canal volume) on the BN.
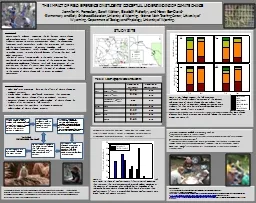
RESULTSPrevalence of bilateral notches: 16.6 % (390 participants)Prevalence of unilateral notches: 39% (914 participants)Figure 1: Audiometric Notch Configuration in the NHANES (2005-2010) database: Mean thresholds at 1000-8000 Hz for participants with no notch (blue line) vs. notched audiogram (red line). Error bars: 95% CI
Associated
VariablesUnilateral Notch (Odds Ratio)Male < Females0.753 (0.618-0.918)African American < European American 0.700 (0.538-0.911)14-15 years > 18-19 years0.753 (0.618-0.918)
Associated VariablesBilateral Notch (Odds Ratio)Male < Females0.585 (0.450-0.761)African American < European American 0.537 (0.376-0.767)Noisy Job > No noisy job1.836 (1.097-3.074)
DISCUSSIONPrevalence of audiometric notch in US youth (16.6%) was higher than its prevalence in college-aged musicians (12%) (Phillips et al, 2015) Almost 42% of the participants showed audiometric notch without reporting a history of a noisy job, music exposure, firearm noise exposure and acoustic exposure before audiometry. Audiometric notch may overestimate NIHL especially when supra-aural transducers are used to measure hearing thresholds (Schlauch & Carney, 2011)Standing waves in the ear canal may be a candidate mechanism leading to higher prevalence of notches in younger children with shorter ear canals.Future research will compare sound pressure levels in the ear canal produced by supra-aural headphones versus insert ear headphones to test the hypothesis that standing waves in the ear canal can cause a notch-like pattern in the absence of noise-induced cochlear damage.