
Systematic In silico analysis using public database Sung Hwan Lee 14 Baek Gil Kim 23 Ho Kyoung Hwang 14 Woo Jung Lee 14 Chang Moo Kang 14 1 Department ID: 926566
Download Presentation The PPT/PDF document "Transcriptome-wide analysis of discrimin..." is the property of its rightful owner. Permission is granted to download and print the materials on this web site for personal, non-commercial use only, and to display it on your personal computer provided you do not modify the materials and that you retain all copyright notices contained in the materials. By downloading content from our website, you accept the terms of this agreement.


Slide1
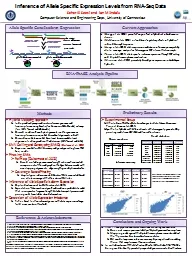
Transcriptome-wide analysis of discriminating gene expression according to metabolic phenotype based on PET scan in resectable pancreatic cancer; Systematic In silico analysis using public database
Sung Hwan Lee1,4, Baek Gil Kim2,3, Ho Kyoung Hwang1,4, Woo Jung Lee1,4, Chang Moo Kang1,4** 1Department of Surgery, 2Department of pathology, 3Brain Korea 21 Plus Project for Medical Science Yonsei University College of Medicine4Pancreaticobiliary Cancer Clinic, Institute of Gastroenterology, Severance Hospital, Seoul, Korea
Slide2BackgroundsPancreatic cancer is one of the most lethal malignant tumors arising from the gastrointestinal tract.Prognostic factors for pancreatic cancerTumor size
Lymph node metastasis & Positive lymph node ratio (LNR)Tumor grade (Differentiation)Lymphovascular & Perineural invasionSurgical margin statusFluorine 18-fluorodeoxyglucose (
FDG) positron emission
tomography (PET)
Differential diagnosis between benign and malignant massesPre-treatment stagingTherapeutic responseRecurrence
Slide3Size-dependent propensity score matched analysis for DFS between high and low MTV (Volume based PET parameter) according to tumor size
Small (<2.5cm) tumor groupLarge (
≥
2.5cm) tumor group
Kang et al. Medicine 95(9):2595
Slide4To identify differential gene expressions between opposite metabolic phenotype of pancreatic cancer
(high FDG uptake tumor vs. low FDG uptake tumor)The aim of this study
Slide5MTV measurement in PET scan (Department of Nuclear medicine)MTV high vs low group database
Randomly selected 3 patients in each groupFFPE block (Tumor, A1)RNA extractionRNA quantification by OD value measurementHybridization by Affymetrix gene chip system (Affymetrix Human U133 plus 2.0)
Methods
Slide6Results
Slide7Scheme of the studyMTV high vs low
Slide8Result I. Pattern analysis for gene expression by Hallmarks of cancer
Slide9Hallmarks of Cancer: The Next GenerationCell (2011) 144;5;646–674
Slide10MTV low
MTV high
Metabolism
Metastasis
EMT
Immune
Angiogenesis
ECM
Apoptosis
Proliferation
TSG
Oncogene
trefoil factor
2
TFF2
forkhead
box
F1
FOXF1
Sp3 transcription
factor
SP3
plakophilin
1
PKP1
microfibrillar
-associated protein
4
MFAP4
thiosulfate
sulfurtransferase
TST
SP3
Sp3
transcription
factor
NFKBIA
nuclear
factor of kappa light polypeptide gene enhancer
H19
imprinted
maternally expressed
transcript
TNK2
tyrosine
kinase, non-receptor,
2
SGK1
serum/glucocorticoid
regulated kinase
1
H19
imprinted maternally expressed transcript
GJB2
gap
junction protein, beta
2
SCGB3A1
secretoglobin
, family 3A, member
1
DMBT1
deleted
in malignant brain tumors 1
TFF2 trefoil factor 2
ALOX5AP arachidonate 5-lipoxygenase-activating protein
FOXF1 forkhead box F1
SP3 Sp3 transcription factor
PKP1 plakophilin 1 (ectodermal dysplasia/skin fragility syndrome)
PGC progastricsin (pepsinogen C)
NFKBIA nuclear factor of kappa light polypeptide gene enhancer
CRELD1 cysteine-rich with EGF-like domains 1
TFF2 trefoil factor 2
ALOX5AP arachidonate 5-lipoxygenase-activating protein
SP3 Sp3 transcription factor
NFKBIA nuclear factor of kappa light polypeptide gene enhancer
GJB2 gap junction protein, beta 2, 26kDa
TNK2 tyrosine kinase, non-receptor, 2
nuclear factor of kappa light polypeptide gene enhancer NFKBIA
gap junction protein, beta 2, 26kDa GJB2
ubiquitin B UBB
anterior gradient homolog 2 (Xenopus laevis) AGR2
trefoil factor 2 TFF2
forkhead box F1 FOXF1
Sp3 transcription factor SP3
plakophilin 1 (ectodermal dysplasia/skin fragility syndrome) PKP1
methyltransferase like 8 METTL8
kynureninase (L-kynurenine hydrolase) KYNU
apolipoprotein L, 1 APOL1
lymphocyte antigen 6 complex, locus E LY6E
trefoil factor 2 TFF2
arachidonate 5-lipoxygenase-activating protein ALOX5AP
Melanophilin MLPH
Landscape of discriminating gene expressions according to Metabolic phenotype
Unpublished data
Slide11Result II.Pathway analysis for gene expression by Pancreatic cancer-specific pathway
Slide12Pancreatic cancer pathway in KEGG. The pancreatic cancer pathway in KEGG is composed of K-Ras/Rho pathway, cell cycle pathway, p53 signaling pathway, TGF-β pathway, and Jak-STAT pathway.
Yunyan
Gu
et al.
Mol
Cancer
Ther
2010;9:2186-2195
Notch signaling pathway
Sonic Hedgehog signaling pathway
Slide13Relative expression of pancreatic cancer specific pathway of MTV high tumorlogFCKRAS/Rho
pathwayCell cyclepathwayp53pathwayTGFbpathwayJak-STAT
pathway
Notch
pathwaySHHpathway
Unpublished data
Slide14Relative expression of individual metabolic pathways of MTV high tumorUnpublished data
Slide15Result III.Network analysis for gene expression using Differentially Expressed Genes (DEGs)
Slide16Hierarchical clustering & Significant genes heatmap between MTV high vs. lowDown-regulation: 71 genesUp-regulation: 14 genes
Relative fold change (MTV high vs low) (log transformed, p-value<0.05)Unpublished data
Slide17<Putative molecular networks between DEGs and major cancer-related gene>
Altered cytoskeletal regulation
Down-regulation of cell adhesion molecules
Up-regulation of mesenchymal phenotypic change
Down-regulation of ubiquitin related tumor suppression
Unpublished data
Slide18Result IV.External validation of survival differences according to DEGs using Public database (NCBI GEO)
Slide19Selection of Validation CohortPDAC (Pancreatic ductal adenocarcinoma)Homo Sapience (Excluding cell lines, Xenograft model)Primary Tissue (Whole Surgical specimen)Expression profiling by MicroarraySurvival data (Survival duration, Death)
31 dataset in NCBI GEO
Matched dataset
(GEO accession: GSE28735) (90 samples, tumor vs non-tumor)3 case excluded (No survival data)
Final enrollment to validation cohort:
42 patients of PDAC
Slide20SurvivorCancer related deathHierarchical clustering of DEGs in validation cohort
Unpublished data
Slide21DES gene
SYNPO2 gene
AGR2 gene
MUC6 gene
P=0.07
P=0.052
P=0.016
P=0.043
DES (+)
DES (-)
SYNPO2 (+)
SYNPO2 (-)
MUC6 (+)
MUC6 (-)
AGR2 (+)
AGR2 (-)
Unpublished data
Slide22P=0.001Survival difference between Combination of DEGs genes and Control
Combination of DEGs genesControl gene setCombination of DEGs genes: Up-regulation of DES & SYNPO2 + Down-regulation of AGR2 & MUC6 Unpublished data
Slide23Summary & ConclusionUp-regulation of glycolysis pathway in metabolic pathway analysis of MTV high groupNo significant result of pancreatic cancer specific signal transduction pathway Altered cell adhesion, cytoskeletal regulation and mesenchymal transition in network analysisSignificant survival prediction of DEGs combination in validation cohort
Slide24Thank you for your attention!