
H20 vapor plays a critical role in the atmosphere Controls clouds and precipitation Moves energy horizontally and vertically Influences temperature Major greenhouse gas Need to have a deep understanding of its properties ID: 910487
Download Presentation The PPT/PDF document "Moisture (H20 vapor, liquid, and solid) ..." is the property of its rightful owner. Permission is granted to download and print the materials on this web site for personal, non-commercial use only, and to display it on your personal computer provided you do not modify the materials and that you retain all copyright notices contained in the materials. By downloading content from our website, you accept the terms of this agreement.


Slide1
Moisture (H20 vapor, liquid, and solid) and Its Measurement
Slide2H20 vapor plays a critical role in the atmosphere
Controls clouds and precipitation
Moves energy horizontally and vertically
Influences temperatureMajor greenhouse gasNeed to have a deep understanding of its properties.
Slide3Solid versus liquid versus gas
Slide4The Concept of Saturation: A Thought Experiment
Imagine an air tight box with liquid water at the bottom and completely dry air above.
Keep at a constant temperature (T) that is above absolute zero.
What will happen?
Liquid Water
Dry Air
Slide5A Thought Experiment
H20 molecules in
liquid are
moving since T>0°K. Not all moving at the same speed.They also have some attraction to each other…that is what a liquid all aboutOnce in a while some of the fastest molecules will escape the liquid and move into the air above as a gas molecule.
Liquid Water
Dry Air
Slide6A Thought Experiment
More and more molecules end up in the dry air
Occasionally, one head back into the liquid
The more molecules in the air above, the more start heading back into the liquid
Liquid Water
Slide7A Thought Experiment
Eventually, there are enough water molecules in the air above so that as many come back to the water as leave.
This equilibrium situation is called
saturation
. The air is saturated with respect to water vapor at that temperature.
Liquid Water
Water vapor
Slide8A Thought Experiment
What if there was a vacuum above the liquid water? Would it make a difference?
NO. Same story
. Water molecules would increase in numbers until there was saturation.So air doesn’t really “hold” water vapor.
Liquid Water
T
> 0°K
Water vapor
Slide9A Thought Experiment
The H20 molecules above the liquid exert a pressure, called the
water vapor pressure.
During our thought experiment the water vapor pressure rose until it reached the
saturation vapor pressure
, the pressure due to water vapor when the air is saturated (holding as much water vapor as it can)
Liquid Water
T
> 0°K
Water vapor
Slide10Vapor Pressures
Note that the
total pressure
we experience and measure is the SUM of the vapor pressures of all the gases around us.Total atmospheric pressure = Vapor Pressure of N
2
+ Vapor Pressure of O
2
+ Vapor Pressure of
Ar
+ Vapor Pressure of H
20 vapor
Slide11Back to the Thought Experiment
What if we raised the temperature of the water?
The water molecules in the water would speed up.
The rate of escape from the liquid would INCREASE.More would go out until a new equilibrium was established, with MORE water vapor molecules than before.
Liquid Water
T
> 0°K
Water vapor
Slide12Back to the Thought Experiment
A new HIGHER saturation vapor pressure would occur.
To say it another way, the saturation vapor pressure increases with
temperatureOr another way, the amount of water vapor in a volume above liquid water increases with temperature.
Liquid Water
Water vapor
Slide13Sloppy Language
One way that this is
often expressed
is by saying that warm air can hold more water vapor than cold airBUT NOTHING IS HOLDING ANYTHING.We would have the same saturation vapor pressure if there was no other air above the liquid.Perhaps “contain” is a better word.
Hold
Slide14Quantitatively: How Does the Amount of Water Vapor that
Contained
in a Volume Increase with Temperature?
EXPONENTIALLY!
Slide15At 35C (95F) the saturation vapor pressure is 4x more than at 10C (50F)
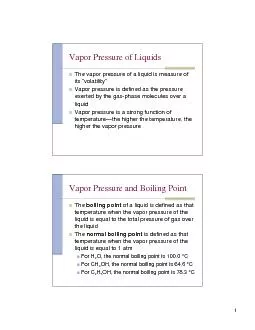
Slide16What happens when the saturation vapor pressure of water equals atmospheric pressure?
You get boiling!
For typical atmospheric pressure (~ 1000
hPa) that occurs around 100°C
Slide17As long as atmospheric pressure is greater than saturation vapor pressure bubbles of water vapor can not grow.
Slide18If atmospheric pressure is lower
than 1000
hPa
, the temperature of boiling is lower. Why? the saturation vapor pressure needed to equal atmospheric pressure is
less. Since saturation vapor pressure depends on T, a lower temperature is needed.
At the top of Mt. Everest (about 29K feet ASL) water boils at 70C (160F)
Denver: 95C, 203F, not 212!
This explain high-altitude cooking instructions for some recipes…need to cook longer to make up for lower boiling temperature
Slide19Needs to be patient
Slide20Measures of H2
0 Vapor in the Atmosphere
Slide21Water Vapor Pressure: Not on Your TV News
H
2
0 vapor pressure: air pressure contribution of water vapor only (hPa
)
Generally not on TV!
Slide22Mixing Ratio
mixing ratio (w) =
mass of water vapor in a sample (g)
mass of dry air in a sample (kg)
Normally in g/kg
Very humid: 15 g/kg
Slide23Saturation Mixing Ratio
At any temperature and pressure there is a maximum mixing ratio, which occurs when air is saturated
saturation mixing ratio (
w
s
)
=
mass of water vapor in a sample of saturated air(g)
mass of dry air in a sample (kg)
Will learn how useful this is in a few minutes…
Slide24Saturation Mixing Ratio Increases Rapidly with Temperature
Slide25Relative Humidity (RH)
= 100*
amount of H20 vapor in the air
max possible amount of H20 vapor in the air at that temp
=100* w/
w
s
RH varies during the 24-h day: lower during the day when temps are high, higher in early morning when temps are low
Slide26Relative Humidity
Another way to understand the diurnal variation:
The mixing ratio, w, stays relatively constant
But ws, the saturation mixing ratio, depends on
temperature
Thus, when temperatures rise,
w
s
rises, w stays the same, and thus w/
w
s must drop.WRF example: https://atmos.washington.edu
/~ovens/wxloop.cgi?wrfd3_rhsfc+2017101312///3
Slide27Dew Point (Td) or Dew Point Temperature
Definition:
the temperature at which air becomes saturated when it is cooled at constant pressure
. Given in F or CMore moisture in
the air
gives a higher dew
point. WHY?
Less
moisture.
lower dew point
At saturation, T = TdTd does not change rapidly
At night, if T drops to Td, dew or fog can form
Td DOES
decline in certain situations, if
dew or fog forms (water is taken out of air
)
Td can increase if water vapor is added.
Slide28Dew Point
Seattle in summer ~45-50F
E. Washington in summer ~20=30F
DC in summer, 65-75FYou feel uncomfortable with high dew pointsReported at airports around the world
Slide29Slide30Measuring Humidity
The classic approach before solid state sensors is to measure both
regular temperature (
dry bulb temperature, Td) and the
wet bulb temperature (T
w
)
at the same time
Definition:
Wet bulb temperature (Tw):
the temperature given by a thermometer with a wet wick. Contrasts with the dry bulb temperature (T
d
), the temperature provided by a normal thermometer
.
Slide31Wet Bulb and Dry Bulb Temperatures
If the air is unsaturated T
d
> TwIf the air is saturated
T
d
= T
w
The bigger the difference, the drier the
air
When rain starts to fall, the temperature often declines to the wet bulb temperature.
Can determine the relative humidity (and dew point) if one has T
d
and T
w
.
Slide32Slide33Slide34Slide35Psychrometers Used to Measure T, Tw and Thus Humidity
Slide36Slide37Digital Hygrometer (taking over)
Uses electronic sensors that can determine atmospheric moisture content
Slide38Why are the interiors of homes and buildings dry in winter?
Dry conditions caused chapped lips, cracked skin, dry mouths, health issues.
Even an issue here in wet Seattle. Why?
Slide39Typical Situation
T=0C (32F) outside, and RH=100%
Air infiltrates into the house and is warmed to 20C (68F)
What is the RH inside?Outside: T=0C, ws= 3.8 g/kgInside: T=2C, ws
= 14.7 g/
kgm
Slide40Saturation mixing ratio (ws
) table
Slide41RH inside the house
RH= 100 * w/
ws
= 100* 3.8/14.7 = 26% RH
If outside air is colder or drier, easy to get RH less than 10% in a home
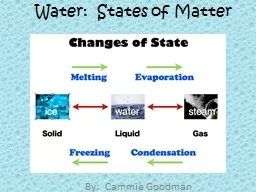
Slide42Slide43Many of the most profound effects of atmospheric moisture is when it experiences phase changes.
Phase change: when a substance goes form liquid to solid, liquid to gas, solid to gas, or vice versa.
evaporation: liquid to gas
condensation: gas to liquid
sublimation: solid to gas (e.g., dry ice or loss of snow)
deposition: gas to solid (frost)
melting: solid to liquid
Freezing: liquid to solid
Slide44Slide45Phase changes of water are associated with heating and cooling, gain or loss of energy
Melting: ice to liquid water
Ice-
in a crystalline structure, with strong bonds. Water molecules can vibrate in positionTo break these bonds takes energy: ~80 calories per gram.
Called the
latent heat of fusion.
When the liquid water later freezes, that amount of heat is released.
This is why orchards in eastern Washington spray water on blossoms in spring when freezing conditions are forecast.
Slide46Slide47Slide48Liquid to Vapor
Evaporation
: liquid to vapor.
Takes energy to break the bonds between water moleculesFor 1 gram of water to go from liquid to vapor takes 600 calories of energyCalled the latent heat of vaporization (600 calories per gram)
When water condenses that energy is released back (often called the
latent heat of condensation
).
Slide49For the earth, HUGE amounts of solar radiation in the tropics/subtropics goes into evaporation water over the tropical and subtropical oceans.
Slide50The water vapor is transported northward and then condenses in midlatitude clouds, releasing huge amounts of heat.
Slide51The evaporation of water over land in the midlatitudes reduces temperature rise at the surface—a lot of the sun’s energy goes into evaporating water
Slide52Two More Phase Changes
Sublimation
: ice to vapor. Requires the
latent heat of sublimation.680 calories per gramAssociated with gradual loss of snow on clear days
Dry ice sublimation
Slide53Deposition
Vapor to ice. Releases 680 calories per gram (Latent Heat of Deposition)
Produces frost.
Slide54Slide55Phase Change Overview
Temperature remains constant during phase changes.
Good way to calibrate thermometers
Slide56