
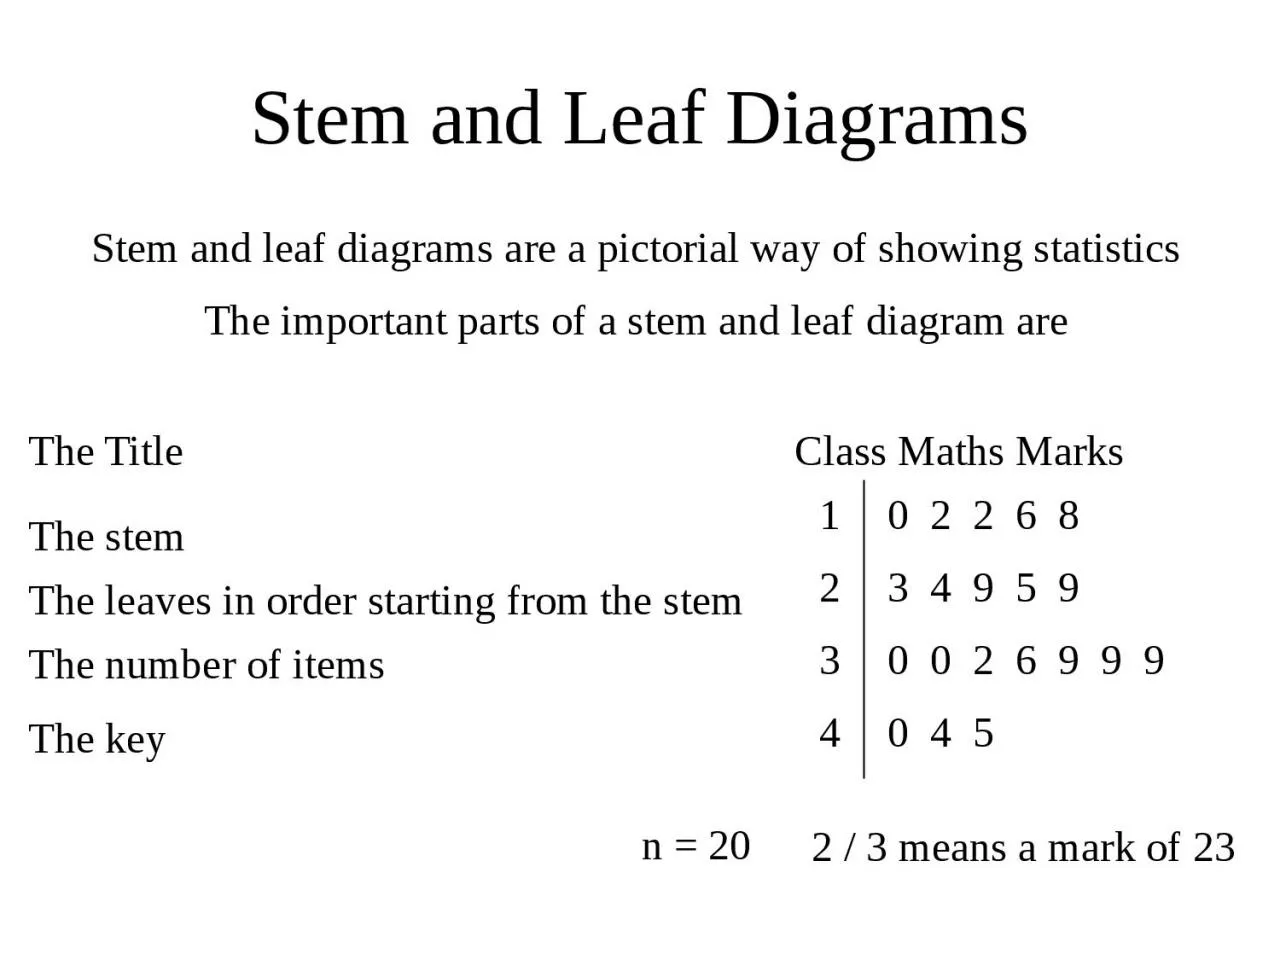
The important parts of a stem and leaf diagram are The Title The stem The leaves in order starting from the stem The number of items The key Class Maths Marks 1 2 3 4 0 2 2 6 8 3 4 9 5 9 ID: 1019836
Download Presentation The PPT/PDF document "Stem and Leaf Diagrams Stem and leaf dia..." is the property of its rightful owner. Permission is granted to download and print the materials on this web site for personal, non-commercial use only, and to display it on your personal computer provided you do not modify the materials and that you retain all copyright notices contained in the materials. By downloading content from our website, you accept the terms of this agreement.


1. Stem and Leaf DiagramsStem and leaf diagrams are a pictorial way of showing statisticsThe important parts of a stem and leaf diagram areThe TitleThe stemThe leaves in order starting from the stemThe number of itemsThe keyClass Maths Marks12340 2 2 6 83 4 9 5 90 0 2 6 9 9 9 0 4 5n = 202 / 3 means a mark of 23
2. A group of students measured their pulse rates in beats per minute. The results were.66 69 62 58 74 56 67 72 61 62 59 60 72 58 63Draw a Stem and Leaf diagram to show thisWe need a titlePulse rates (beats per minute)We need the stems567We need the Leaves8 6 9 86 9 2 7 1 2 0 34 2 2We need to reorder the leaves6 8 8 90 1 2 2 3 6 7 92 2 4We need to write in nn = 15We need the key6 / 2 means 62 beats per minute
3. A group of students were asked how much pocket money they get. The results were.£6.60 £6.90 £6.20 £5.80 £7.40 £5.60 £6.70 £7.20£6.10 £6.20 £5.90 £6.00 £7.20 £5.80 £6.30Draw a Stem and Leaf diagram to show this6 8 8 90 1 2 2 3 6 7 92 2 4n = 156 / 2 means £6.20567Pocket moneyNote this gives us the same diagram as the previous example. This shows the importance of the title and key.
4. Draw Stem and Leaf Diagrams for the following sets of dataThe speed of cars, in mph, passing police speed check35 46 32 48 53 58 60 39 36 48 34 51 42 37 53 42 51 38John took a note of how far, in metres, he was able to hit a golf ball108 115 132 121 101 122 138 127 105 112 118 127 129 120 139 136 131 121 111 129 137Speed in mph3 2 4 5 6 7 8 94 2 2 6 8 81 1 3 3 86 0n = 18 4/3 means 43mphDistance in metres10 1 5 811 1 2 5 812 0 1 1 2 7 7 9 913 1 2 6 7 8 9n = 21 12/3 means 123m
5. Stem and Leaf diagrams can be used to compare 2 sets of data.To do this we draw a back to back stem and leaf diagram.0123488 5 39 4 4 5 2 06 4 3 1 1 07 3 36 8 91 2 2 2 5 5 80 0 1 1 6 73 7 71Maths marks for class 1AMaths marks for class 1Bn = 19n = 203/2 means a mark of 32How many students in 1A had a mark of 31?How many students in 1B had a mark of 12?Which class appears to be best at Maths?231A
6. Use the Back to Back Stem and Leaf Diagram to answer the questionsBooks borrowed from the libraryThis week Last week 2 0 1 4 1 3 1 5 6 7 4 4 3 4 0 4 5 1 0 5 2 4 1 6 3 n = 10 n = 10 2/0 represents 20 booksHow many books were borrowed at level 3 this week?How many books were borrowed at level 4 last weekWhich week was best for the libraryHow many books were borrowed last week altogether65?129?This week?387