
The phase difference in degrees is calculated fromThe Time BaseThe TIMEDIV control determines the horizontal scale the time scale of the graphwhich appears on the oscilloscope screen This is achieved ID: 861370
Download Pdf The PPT/PDF document "PhasePhase is best explained by looking ..." is the property of its rightful owner. Permission is granted to download and print the materials on this web site for personal, non-commercial use only, and to display it on your personal computer provided you do not modify the materials and that you retain all copyright notices contained in the materials. By downloading content from our website, you accept the terms of this agreement.


1 PhasePhase is best explained by looking
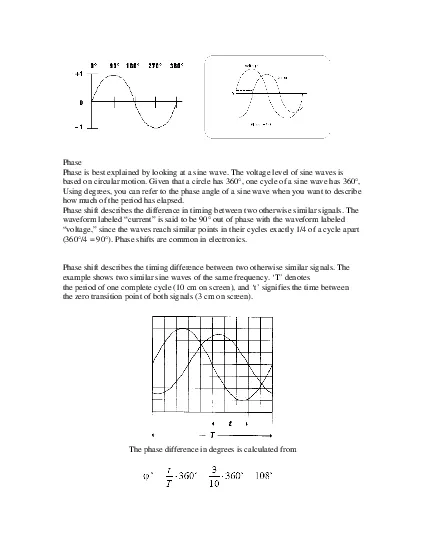
PhasePhase is best explained by looking at a sine wave. The voltage level of sine waves is based on circular motion. Given that a circle has 360°, one cycle of a sine wave has 360°, Using degrees, you can refer to the phase angle of a sine wave when you want to describe how much of the period has elapsed. Phase shift describes the difference in timing between two otherwise similar signals. The waveform labeled current is said to be 90° out of phase with the waveform labeled voltage, since the waves reach similar points in their cycles exactly 1/4 of a cycle apart (360°/4 = 90°). Phase shifts are common in electronics. Phase shift describes the timing difference between two otherwise similar signals. Theexample shows two similar sine waves of thesame frequency. T denotesthe period of one complete cycle (10 cm on screen), and t signifies the time between the zero transition point of both signals (3 cm o
2 n screen). The phase difference in degr.
The phase difference in degr")
n screen). The phase difference in degrees is calculated from The Time BaseThe TIME/DIV control determines the horizontal scale (the time scale) of the graphwhich appears on the oscilloscope screen. This is achieved by a sweep voltage that is applied to the X plates of the oscilloscope. It is so called because it is used to sweep the electron beam horizontally across the screen.Rise TimeWhen dealing with square or pulse waveforms, the critical feature is the rise time of thevoltage. The rise time of a signal is defined as the time required for its leading edge torise from 10 percent of its final amplitude to 90 percent of its final amplitude.6. Amplitude and Frequency MeasurementGenerally, amplitudes of alternating voltages are quoted as RMS (root-meansquared)values. However, when measuring the magnitude of such a signal using an oscilloscope, the peak to peak voltage (Vpp) value is used. It is also i
3 mportant to note that the amplitude of o
mportant to note that the amplitude of one half of the cycle is known as the peak voltage (Vp). The relationship of all three voltage levels can be seen in Fig. 3.The peak to peak voltage and the peak voltage can be converted to RMS as follows: If a signal repeats, it has a frequency. This frequency is measured in Hertz (Hz) and equals the number of times the signal is repeated in one second (cycles per second). The signal also has a period, which is the time taken for one complete cycle to occur before it starts to repeat itself.The oscilloscope can be used to measure the frequency of a repetitive signal. This isachieved by measuring the period of one complete cycle on the screen of theoscilloscope. Since period and frequency are reciprocals of each other (i.e. 1/period equals the frequency, and 1/frequency equals the period), the time taken for one cycle (the period) can be used to calculate the frequency