
The Problems Long Lake Algal Bloom 2015 HAB Turbidity caused by Inorganic TSS and organic solids TVS Turbidity decreasing Zebra mussels Common Carp Potential influences Round lake drain ID: 602235
Download Presentation The PPT/PDF document "Long Lake management issues" is the property of its rightful owner. Permission is granted to download and print the materials on this web site for personal, non-commercial use only, and to display it on your personal computer provided you do not modify the materials and that you retain all copyright notices contained in the materials. By downloading content from our website, you accept the terms of this agreement.


Slide1
Long Lake management issues
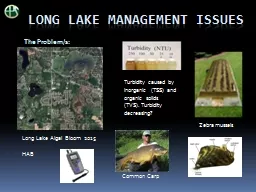
The Problem/s:
Long Lake Algal Bloom 2015
HAB
Turbidity caused by
Inorganic (TSS) and organic solids (TVS). Turbidity decreasing?
Zebra mussels
Common CarpSlide2
Potential influences
Round lake drain urban non-pointEagle Creek Drain urban non-point
Squaw Creek ag and urban non-pointBaxter
residential sewage ( point source ) Legacy loadings from previous STPs*Mud Lake ( intercepts P and sediment)Slide3
Blue green algal bloom caused by “Annie, Fanny, and Mike
Anabaena sp.
= Annie
Aphanizomenon
= Fanny
Microcystis
= mikeSlide4
Impact of Blue Green Algal Blooms:
Temporarily closed down drinking water
source on Lake Erie
Increased turbidityChanges in fish food chains Changes in macroinvertebrates/aquatic insects
Potential toxicity ( nuerotoxins and liver toxins)Suppress growth of “good” plants
Interact with zebra mussels/ mussels can actually promote blue green bloomsNegative impact on recreational fisheries
Potential loss of recreational use….dependent on density
Are found everywhere but size ( population numbers) matters
NOT NICE
! Say thank for your oxygen today however Slide5
Classes of Pollutants and Their Typical Origin
Salt …. street run-off, winter de-icing ( avg. in county vs. USEPA standard)
Metals (
Cu,Zn,Pb)….street runoff; sewageNutrients ( P, NH3-N,NO3 )….Ag. Run-off, sewage, lawn fertilizers + legacy in bottom sediments
BOD= Biological oxygen demand…..sewage treatment, animal wasteSuspended Solids ( sediment)….Ag. Run-off, construction sites, bank erosionVolatile Organics ( gas,oil,solvents)….urban @ special locations like gas stations
PNAs (organics from street treatments)….driveway sealants
Size ( amount or concentration ) mattersSlide6
Phosphorus
however drives basic productivity in lakes and is the most important nutrient which is responsible for blue-green algae blooms.
Two ways to evaluate P :
1.) Concentration= weight/volume of liquid
.05 mg/l is State Standard routinely violate state standard for all yrs. 2005-2016 avg. in surface = .091 2X state standard
avg. below= .626 3.5X county avg. 10X s.s. Significant
2.) Load= total weight delivered to the lake / unit of time lbs. or kg /day for the whole lake lbs. or kg/ year for the whole lake
loading determines concentration
SIZE MATTERSSlide7
Squaw Creek/Long Lake Watershed & Water Quality StudiesSlide8
Measured flow, water quality parameters
( weekly) including
P and TSS
Measured rainfall, evaporation, soil moisture land use, etc.
Created detailed watershed modelTotal cost $500,000
Conclusions and significance:
Annual load and discharge from Baxter similar to 1.5% of total2. Principal load for Long Lake= internal load from historic STPs
3. Mud Lake mitigates or intercepts 35% to 85% of P and TSS dependent on flow4. Model can be “updated” and used in future years
2001 to 2004
Size mattersSlide9
2001 to 2004
Conclusions of Stanley Eng. Study
Size mattersSlide10
2004
Multiagency Management Plan
Identified land use practices, green infrastructure, stream bank stabilization opportunities, flood control opportunities
Multiple nutrient and sediment reduction efforts for both agricultural and urban land use
Conservation plan for the watershed
Conclusions and Significance:
SMC has 34 conservation projects on watershed
25,250 acres means significant discharge to Long Lake
Need to update Watershed Plan
Need to validate yearly load assessments
Size ( of watershed P and TSS) mattersSlide11
2005 to 2016
Monitored water quality in upper and lower layers of lake
No discernible trend in
Total P or TSS
Long Lake
P limited
in almost all yearsAvg. Water clarity decreased by close to a foot (2005 to 2015)
Documented potential hazardous blue-green algal bloom ( 2015)
Conclusions and Significance:
Use impairment is increasingManagement intervention is desirable
Need to evaluate internal and external P loadsNeed to extend monitoring to the watershed and outlet
Size and Origin of the Loading Matters for
Framing Future Management…..Size MattersSlide12
2017
Standards violation
TMDL analysis
July of 2017…engineering firm is doing analysis
TMDL= 1. export from watershed model
2. and lake response model
TMDL Analysis = amount of P loading that is required to meet the State Standards for Total P
Long Lake
State StandardSlide13
So What Needs to Happen ?Slide14
P Control Options:
Aeration ( large scale)
Alum Treatment
Hypolimnetic withdrawalDredging
Optimize wetland interception at Mud LakeCarp removal
Optimize nutrient treatment across watershedBaxter sewage rerouting
Analytic Options
Scale up watershed water quality monitoring and analysis
Update Baxter Watershed Model
Update SMC Watershed PlanObtain 319 Funds from IEPA and update TMDL analysisPrepare a Lake Management Plan
Determine Internal Loading estimates w LCHDSlide15
Some lesser known residents of Squaw Creek/Long Lake
Orangespotted sunfish
Lepomis humilis
Bookmarks