
http bloomingtoningovdocumentsviewDocumentphpdocumentid2455dirbuildingbuildingfootprintsshape https datacityofchicagoorgBuildingsBuildingFootprintsw2v3isjw A lot of POI datasets eg in Google Earth are becoming available now ID: 242361
Download Presentation The PPT/PDF document "Motivation: Availability of Urban Data" is the property of its rightful owner. Permission is granted to download and print the materials on this web site for personal, non-commercial use only, and to display it on your personal computer provided you do not modify the materials and that you retain all copyright notices contained in the materials. By downloading content from our website, you accept the terms of this agreement.


Slide1
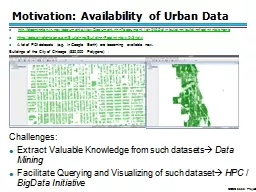
Motivation: Availability of Urban Data
http://bloomington.in.gov/documents/viewDocument.php?document_id=2455;dir=building/buildingfootprints/shapehttps://data.cityofchicago.org/Buildings/Building-Footprints/w2v3-isjw A lot of POI datasets (e.g. in Google Earth) are becoming available now. Buildings of the City of Chicago (830,000 Polygons) :Challenges:Extract Valuable Knowledge from such datasets Data MiningFacilitate Querying and Visualizing of such dataset HPC / BigData InitiativeSlide2
2
Project5 Questions for Dataset Zinj
Are buildings randomly distributed or is there some clustering?
Are buildings of the same building type collocated, anti-collocated or
not?
Are
building belonging to different building types collocated, anti-collocated or not—for example, you will try to answer the question if garages are collocated with commercial buildings.
Idea to answer question: create curves based on number of objects within the radius of another object/kNN-distance,… and obtain answers by comparing curves generated for different contexts.
See:
http://
wiki.landscapetoolbox.org/doku.php/spatial_analysis_methods:ripley_s_k_and_pair_correlation_function
Slide3
Example: Collocation Red and Green Objects
FOR radii r1,…,rn DO FOR all green objects g DO Compute #-of-red objects within radius rj of g ENDDO Compute average roj of values observed in previous loop Put entry (rj, (roj/total_number_of_red_objects)) into Curve ENDDO Slide4
An Alternative Approach Using
k-Nearest-Neighbor DistanceFOR k=k1,…,kr DO FOR all green objects gp DO Compute distance rdp to k-nearest red object to g ENDDO Compute average rdi of values observed in previous loop Put entry (ki, rdi) into the Curve ENDDORemark: For k-values use 0.1% of the red objects; 0.1*1.5 of the red objects
, 0.1%*1.52 of the red objects ,
0.1%*1.5
3
of the red objects
,…, until at most 50% of the red objects—with x being the ceiling function computing the smallest integer that is greater equal than x.
d
1
d
3
d
6