
some dos and donts Hans Burgerhof Medical S tatistics and Decision Making Department of Epidemiology UMCG Help Statistics Lunchtime Lectures When Where What ID: 652718
Download Presentation The PPT/PDF document "Multiple linear regression" is the property of its rightful owner. Permission is granted to download and print the materials on this web site for personal, non-commercial use only, and to display it on your personal computer provided you do not modify the materials and that you retain all copyright notices contained in the materials. By downloading content from our website, you accept the terms of this agreement.


Slide1
Multiple linear regression;some do’s and don’ts
Hans Burgerhof
Medical
S
tatistics
and
Decision
Making
Department
of
Epidemiology
UMCGSlide2
Help! Statistics! Lunchtime LecturesWhen?
Where?
What?
Who?Jun 13 2017Room 16Multiple TestingC. Zu EulenburgSep 12 2017H. BurgerhofOct 10 2017D. PostmusNov 14 2017S. La BastideDec 12 2017C. Zu Eulenburg
What? frequently used statistical methods and questions in a manageable timeframe for all researchers at the UMCG No knowledge of advanced statistics is required.When? Lectures take place every 2nd Tuesday of the month, 12.00-13.00 hrs.Who? Unit for Medical Statistics and Decision Making
2
Slides
can
be
downloaded
from
http://www.rug.nl/research/epidemiology/download-areaSlide3
Today’s ProgramIntroduction
data
and
research questionLinear regression, what is it?What are the underlying assumptions to make it a valid analysis?Simple linear regressionMultiple linear regressionInteraction termsCategorical explanatory variablesHow to build a model?Slide4
The research questionW. Heesen: Isolated Systolic Hypertension, PhD thesis written 1998Cross sectional
data on 1596
individuals
in the North of the Netherlands, all older than 57 yearsFor now:Which explanatory variables are related with the Systolic Blood Pressure, SBP?Can we predict (or explain) the SBP, using several explanatory variables?Slide5
The data in SPSSSlide6
Multiple relationshipsSlide7
A simple linear regression modelIn mathematics, the
equation
of a line is
given by: y = a∙x + bIn statistics, we prefer the formula: y = bo + b1∙xb1 is the slope of the lineb0 is the intercept (or constant)YXb1a0Slide8
Simple linear regression of SBP on Age(a continuous explanatory variable
)Slide9
The best fitting line(according to “least squares” criterion)
SBP = 110 + 0.75
∙AgeSlide10
FormallyWe assume that in the population the relation between Y and X is:
e
(the error or
residual) is a random variable from a normal distribution with unknown variance. This variance of e is independent from the value of X (homoscedasticity)Slide11
The best fitting line(according to “least squares” criterion)
SBP = 110 + 0.75
∙Age
H0: β1 = 0Slide12
The explained part of the response variable Y (R2)
Model Summary
Model
RR SquareAdjusted R SquareStd. Error of the Estimate1,216a,047,04622,481a. Predictors: (Constant), age in 1993
4.7% of the variation in Blood Pressures can be explained by the variation in Ages.The R
2 gives
you
information
about
the fit of the model.
The
higher
the R
2
, the
better
the fit.Slide13
Assumptions of linear regressionThe outcome variable Y is a continuous
variable
Independent observationsLinear relation (instead of e.g. exponential) between Y and XThe residuals come from a normal distributionThe variability of the residuals is the same for each value of X (homoscedasticity)Slide14
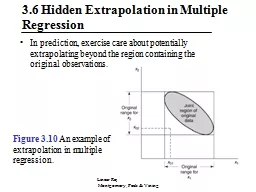
In case of repeated measures (on the same individuals) …
DON’T
These data
should be analyzed using a more complex analysisSlide15
The linear regression table (SPSS)
Coefficients
a
ModelUnstandardized CoefficientsStandardized CoefficientstSig.BStd. ErrorBeta1(Constant)110,2935,691 19,379,000age in 1993,752
,085,2168,825,000
a. Dependent Variable: syst. blood pressure in 1993
Based
on the P-
value
of the
slope
, we
would
conclude
that
there
is a significant
linear
relationship
between
Age
and
SBP.
Is
it
a
valid
conclusion
, is
it
a
valid
test?Slide16
Check the assumptionsIndependent observations how
have the data been
collected
?Linear relation (instead of e.g. exponential) between Y and X make a scatterplot (you started with it!)The residuals come from a normal distribution make a histogram or P-P plot of the residualsThe variability of the residuals is the same for each value of X (homoscedasticity) make a scatter of residuals against predicted valuesDOSlide17
Checking the residualsSlide18
Simple linear regression of SBP on Sex(a
binary
explanatory variable)MenWomenSlide19
Linear regression, is it of any use in this
situation
?
DODON’Tor?Slide20
Regression on Sex
Coefficients
a
ModelUnstandardized CoefficientsStandardized CoefficientstSig.BStd. ErrorBeta1(Constant)159,257,857 185,882,000sex1,8531,157,040
1,602,109a. Dependent Variable: syst. blood pressure in 1993
Group
Statistics
sex
N
Mean
syst. blood pressure in 1993
man
721
159,26
woman
875
161,11
t-test for independent
groups
:
Independent Samples Test
t-test for Equality of Means
t
df
Sig
. (2-tailed)
Mean
Difference
Std
. Error
Difference
syst
.
blood
pressure
in 1993
-1,602
1594
,109
-1,853
1,157Slide21
So:Performing a simple linear regression with a binary explanatory
variable
is equivalent to performing a t-test for independent groups, assuming equal variancesWhy using a linear regression in this situation?If you want to correct (adjust) for the effect of other variables, you cannot do it in a t-test, but you can do it, using a multiple linear regression DOSlide22
Correcting for AgeMean Age of men: 65.9 years, Mean Age of women
: 67.0
years
There is a significant positive relationship between Age and SBP.Women have higher SBP (on average) than men Can the higher SBP for women be (partly) explained by the difference in Age?Slide23
A multiple linear regression
Coefficients
a
ModelUnstandardized CoefficientsStandardized CoefficientstSig.BStd. ErrorBeta1(Constant)110,1465,694 19,344,000sex1,0471,135,023
,922,356age in 1993,746
,086
,214
8,720
,000
a. Dependent Variable: syst. blood pressure in 1993
Sex
is
still
not
a significant predictor for SBP, but the
difference
between
the
mean
SBP’s
is smaller
than
in the
unadjusted
analysis
SBP = 110.15 + 1.05
∙Sex + 0.746∙AgeSlide24
In a graph
Two
lines for the price of one!Slide25
Should we always correct for other variables?
Sex
SBP
AgeIn this graph, a causal pathway called DAG (Directed Acyclic Graph), Age is a mediator of the effect of Sex on SBP.If you are interested in the total effect of Sex on SBP, do not include Age in the model. If you are interested in the direct effect of Sex on SBP only, correct for Age.
In experimental studies, you can correct for Age by designSlide26
Effect modificationWhat if we think that the effect of Age on SBP might be different for
males
compared to females?Also called “interaction”, “synergy”, “moderation”, …Slide27
In a linear regression model, we have to introduce an interaction term
Generally the product of the
main
effects: intAgeSex = Age∙SexMales (coded 0): SBP = β0 + β2∙AgeFemales (coded 1): SBP = β0 + β1 + β2∙Age + β3∙Age == (β0 + β1
) + (β2+ β3)∙Age
Slide28
Linear regression of SBP on Smoking(a categorical
explanatory
variable > 2 categories)DOor?DON’TNo periodOne periodBoth periodsSBP = b0 + b1∙SmokingHistory ?Slide29
For a categorical explanatory variable: use dummy variables!
DO
Categorical
Variable (Smoking)Dummy1Dummy2No period00One period10Both periods01Use the R2 change test to test the effect of the categorical
variable. Do not delete non-significant dummies without a good reason!
SBP = b
0
+ b
1
∙Dummy1
+
b
2
∙Dummy2 Slide30
How to build a (linear) model?Select variables based on theory
and
/or univariate analyses (on a liberal alpha)Make a multivariate model including all possibly relevant variablesEliminate backward step-by-step non-significant variables ( = 0.05)Only test for interactions based on theory or clear patterns in your dataGive the R2 of the final model Slide31
A linear model?
This is still a linear model; it is linear in its parameters!DOSlide32
Take home message
Take
to
work message(regarding linear regression analyses)Start with graphs (for continuous X)Check the assumptionsTest for relevant interactionsSelect variables on a liberal alphaGive R2 in your articleDODON’TInclude all variables, just because
you measured themIf you torture your data long
enough …
Use
arbitrary
codes for
categorical
data (
with
more
than
two
categories
)