
Motion Too high of a helical pitch Oil in the xray tube housing Failure to turn on a beam hardening correction History An adult head is scanned using a helicalspiral mode and the resulting images exhibit hypo and hyper intensities at the brainbone interface and a blurry appearance througho ID: 1041899
Download Presentation The PPT/PDF document "Thursday Case of the Day" is the property of its rightful owner. Permission is granted to download and print the materials on this web site for personal, non-commercial use only, and to display it on your personal computer provided you do not modify the materials and that you retain all copyright notices contained in the materials. By downloading content from our website, you accept the terms of this agreement.


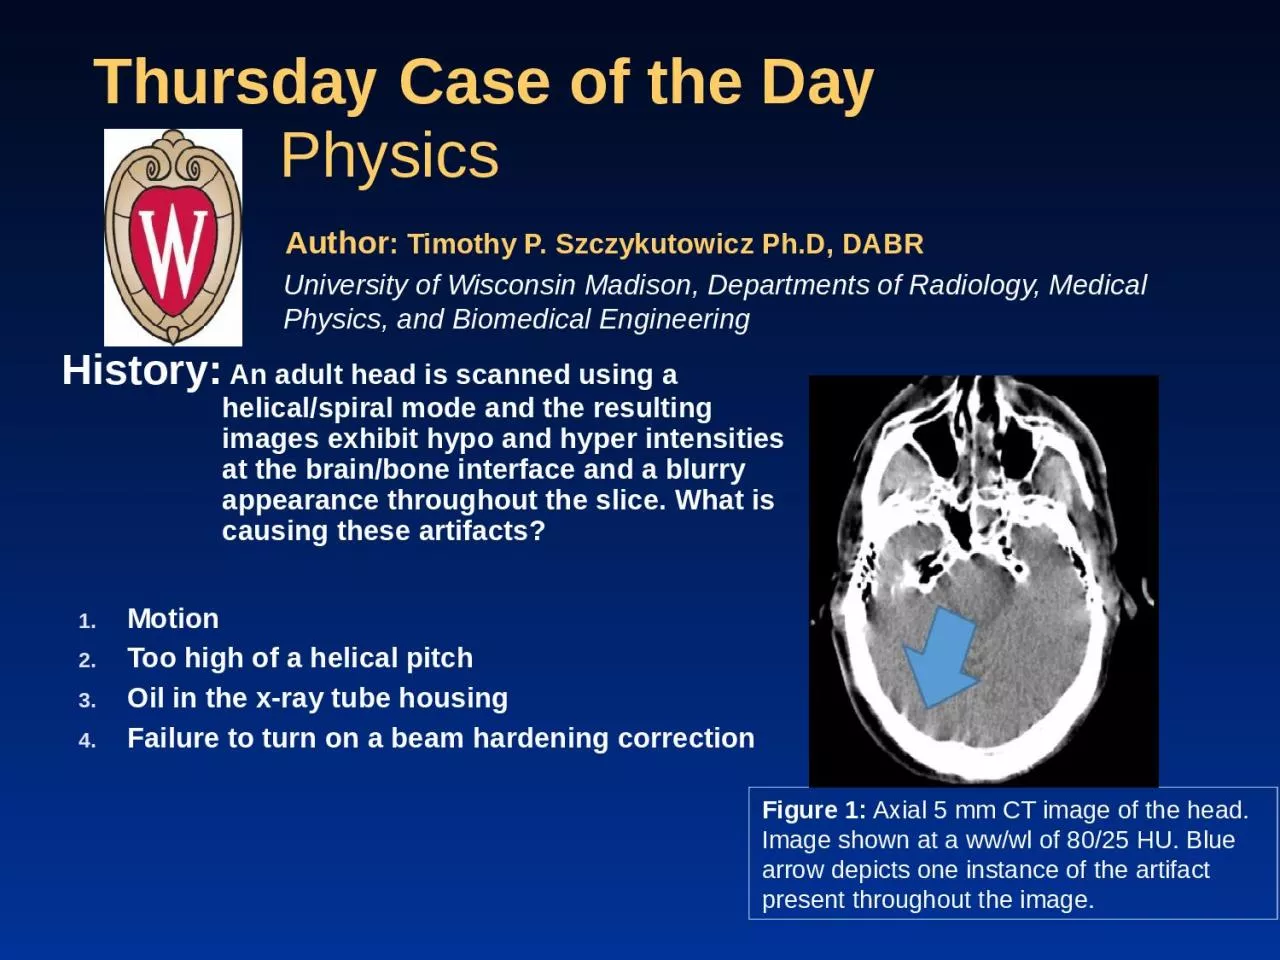
1. Thursday Case of the DayMotionToo high of a helical pitchOil in the x-ray tube housingFailure to turn on a beam hardening correctionHistory: An adult head is scanned using a helical/spiral mode and the resulting images exhibit hypo and hyper intensities at the brain/bone interface and a blurry appearance throughout the slice. What is causing these artifacts?Author: Timothy P. Szczykutowicz Ph.D, DABRUniversity of Wisconsin Madison, Departments of Radiology, Medical Physics, and Biomedical EngineeringPhysicsFigure 1: Axial 5 mm CT image of the head. Image shown at a ww/wl of 80/25 HU. Blue arrow depicts one instance of the artifact present throughout the image.
2. Diagnosis: A. Motion artifact.
3. Solution Detail: Too high of a helical pitch will cause artifacts, especially near bony/soft tissue interfaces. The artifacts from high pitch scanning, however, do not produce the blurry appearance observed in this case. Artifacts from high pitch scanning will produce “windmill” streaks emanating from bony structures or air in the axial plane as opposed to the more global streaks produced by head motion in an axial/sequential scan.Oil in the x-ray tube housing produces low frequency hypo and hyper intensities throughout an image of a low frequency “blotchy” appearance. These artifacts appear intermittingly, and seemingly randomly as the bubble moves about the housing. The bubbles only cause artifacts when they travel between the focal spot and the x-ray exit window. Failure to turn on a beam hardening algorithm would not produce the blurry appearance observed in this case. Failure to activate a beam hardening algorithm would produce shading artifacts connecting regions of high density bone and may blur the brain/bone interface.There is a fundamentally different appearance of motion artifacts depending on scan mode. In axial/sequential scan modes, motion usually induces streak like artifacts, while in helical/spiral scan modes motion induces the artifacts emanating locally from regions of high CT number changes aligned along a single direction.Advance to the next slides to see detailed image based examples of each of the proposed solutions.
4. Discussion: Axial/sequential versus helical/spiral motion artifact appearance Figure 2: (Left) The blue arrow points out the motion induced artifact in the axial plane from a helical/spiral scan. (Middle) More obviously, the yellow arrow shows how the sphenoid bone is “doubled”, an obvious sign that the scan suffers from motion. (Right) The red arrows on this sagittal slice show how the motion artifacts appear to “shift” slabs of the head. The regions of the apparent “breaks” in the skin line correspond to the places where the scanner was when the patient moved.Figure 3: Motion artifacts in axial/sequential mode appear as global streaks (i.e. not localized just to certain regions of the head) across the head in one direction. The streaks do not exhibit any “bending”, the streaks are straight across the image. (left) and (right) show two different patients both suffering from motion.Helical Spiral scan artifact appearanceAxial Sequential artifact appearance
5. Discussion: Axial/sequential versus helical/spiral motion artifact appearance Figure 4: In a helical/spiral data acquisition, data is usually needed from 360 degrees about the patient, and that data is interpolated from view angles mostly out of plane of the reconstructed slice. When motion corrupts some of the projection data, that corrupted data is spread throughout the image volume because of the width of the filter used to combine data across the detector and view angle. The corrupted data will produce artifacts strongest for the view angle/s over which the motion occurred and to a lesser and lesser amount as one moves to view angles acquired during no/lesser motion as more and more non-motion corrupted data is used in the interpolation. This is why the motion induced artifacts do not form along straight lines. Figure 5: In an axial/sequential scan mode, the two projections having the largest disagreement are the ones at the start and the end of the scan. This is why we see motion artifacts in an axial/sequential scan mode occurring all along the same line. That line corresponds to where the CT scanner started/ended acquiring projection data. On some scanners, this angle is always the same, on other scanners, it will be random. The starting angle being fixed or being random is vendor/model dependent.By the end of the scan, the head has movedThe view angles at the start and end of the scan “see” the head has moved by the biggest amount.Since the views at the start and end contain information that is not consistent, we see artifacts projected through the image along that view angleHelical images contain data from multiple detector channels and view angles acquired at different time points acquired over time periods > 1 rotationHelical interpolation scheme, from “Computed Tomography” by Willi A. Kalender. Publicis Corporate Publishing 2005
6. Discussion: High pitch artifacts appearanceFigure 6: High pitch (>1) axial and coronal images shown on the left exhibit more helical artifact relative to low pitch (~0.5) images shown on the right. Blue arrows denote artifacts observed in the high pitch example that are not present in the low pitch example. The form of these high pitch artifacts is unique from the motion induced artifacts of both axial and helical modes shown in Figures 2 and 3. High pitch artifacts emanate from locations within the scan volume where large changes in CT number occur in the z direction. Often, they are referred to as “windmill” artifacts owing to the fact they rotate as one progresses through an axial image volume. Phantom used in this exampleHigh pitchLow pitch
7. Discussion: Oil in the x-ray tube artifact appearanceFigure 8: Two QA images taken 30 seconds apart, the artifact only appears in one of them! Bubbles in the cooling oil float around inside the tube housing. When they happen to be located between the focal spot and exit window, we see issues. This artifact is arguably the most serious issue one can have with their CT scannerIt mimics pathologyIt occurs randomlyFigure 7: Examples of a routine head scan suffering from bubble artifacts (yellow circles). These artifacts mimic a wide variety of pathologies.
8. Discussion: Beam hardening correction artifact appearanceInserting additional slides for Discussion: Before filling in this slide, click on “Insert” in the top bar and select “Duplicate Slide”. Then return to previous slide.Figure 9: Examples of head image quality with and without a full beam hardening correction applied. All images in this figure have a soft tissue beam hardening correction, but only the left column has an additional bone beam hardening correction applied. One can see how the additional bone correction improves the brain bone interface (blue oval) and removes the hyper intensity between the posterior fossa (i.e. “Hounsfield bar”, shown by the blue arrow).Phantom used in this exampleBeam hardening correction onBeam hardening correction off
9. References/Bibliography: General Artifact articles Barrett, Julia F., and Nicholas Keat. "Artifacts in CT: recognition and avoidance." Radiographics 24.6 (2004): 1679-1691.Oil Bubble articleTrieu, Nelson, et al. "Artefact on CT brain images caused by the presence of air bubbles in the cooling oil of the X‐ray tube." Journal of medical imaging and radiation oncology 61.2 (2017): 197-203.