
in given Water Sample Presented by Manoj Joshi Department of Zoology UCoSMLSU Udaipur Class BSc III Year Practical Date 14102020 Time 03000500PM Principle ID: 1034098
Download Presentation The PPT/PDF document "“Estimation of Alkalinity" is the property of its rightful owner. Permission is granted to download and print the materials on this web site for personal, non-commercial use only, and to display it on your personal computer provided you do not modify the materials and that you retain all copyright notices contained in the materials. By downloading content from our website, you accept the terms of this agreement.


1. “Estimation of Alkalinity in given Water Sample”Presented by Manoj JoshiDepartment of ZoologyUCoS,MLSU, Udaipur.Class- B.Sc. III Year PracticalDate: 14.10.2020 Time: 03:00-05:00PM
2.
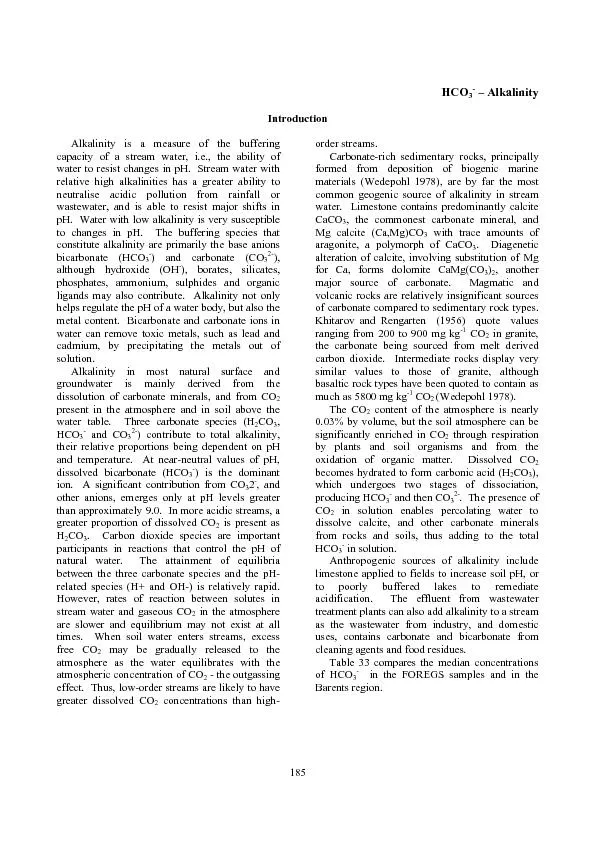
3. PrincipleAlkalinity in water is due to presence of OH-, CO3- and HCO3-. Alkaline water gives yellow colour with methyl orange indicator and pink colour with Phenolpthalein indicator. Apart from these in colourful water in natural conditions humic acid and fulvic acid gives alkalinity. If in the given sample Carbonate is present then it has pH 8.3 and by adding Phenolpthalein indicator it shows pink colour. If methyl orange indicator is added then sample contain yellow colour with is converted in pink colour while it is titrated with acid.
4. Reagents:- o.1 N HCl:- 34ml HCl + 100 ml DW. Methyl orange indicator Phenolpthalein indicator. Experiment Procedure:- Take 50 ml sample in a conical flask.Add 2 drop of Phenolpthalein indicator if it gives pink colour then titrate with HCl till disappear of colour and note the reading. Add 2 drop of Methyl orange indicator and titrate with HCl till pink colour disappearance and note the reading.Repeat the process 3 time for better result.
5. Observation table:- ExperimentS. NoSample in mlBurette Reading For Phenolpthalein indicatorFor Methyl orange indicator StartEndTotal (A)StartEndTotal (B)123
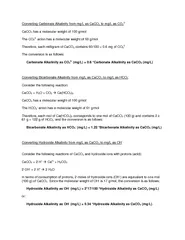
6. ExperimentCalculation:- PA = A x N of HCl X 1000 x 50 ml of sample = A x 0.1 x 1000 x 50 50 = A x 100 mg/L.TA = B x N of HCl X 1000 x 50 ml of sample = B x 0.1 x 1000 x 50 50 = B x 100 mg/L.
7. Thank You