
with learning disabilities between 2004 and 2014 in Scotland Results Introduction People with learning disabilities are prescribed psychotropic medications particularly antipsychotics at rates that do not correlate with reported rates of mental illhealth ID: 1036468
Download Presentation The PPT/PDF document "Trends in antipsychotic drug prescribing..." is the property of its rightful owner. Permission is granted to download and print the materials on this web site for personal, non-commercial use only, and to display it on your personal computer provided you do not modify the materials and that you retain all copyright notices contained in the materials. By downloading content from our website, you accept the terms of this agreement.


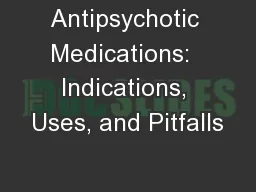
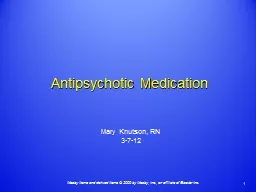


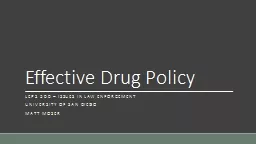
1. Trends in antipsychotic drug prescribing in adults with learning disabilities, between 2004 and 2014 in ScotlandResultsIntroductionPeople with learning disabilities are prescribed psychotropic medications, particularly antipsychotics, at rates that do not correlate with reported rates of mental ill-health. These drugs are often used for indications that they are not licenced for, for example to manage problem behaviours. Clinical guidelines recommend that antipsychotics are reduced or withdrawn in people who do not have psychosis. Few studies analyse psychotropic prescribing over time.Angela Henderson, Colin McCowan, Deborah Kinnear, Paula McSkimming, Kevin Ross, Jill Morrison, Linda Allan, Sally-Ann Cooper, University of Glasgow, Institute of Health and WellbeingMethodsAdults (aged 16 years and over) with learning disabilities living within the geographical area of Greater Glasgow and Clyde Health Board, Scotland, were identified and recruited:Large, population-based, cross-sectional samplesLongitudinal cohort Psychotropic medications were analysed at 2004 (T1), 2006 (T2), and 2014 (T3)Logistic regressions with the longitudinal cohort, to determine whether there was an association between taking each type of medication and time (adjusting for T1 gender, age, level of learning disabilities, mental ill-health, and problem behaviours)Project AimsTo analyse trends in psychotropic prescribing over a decade in ScotlandSampleCross-sectional samples’ prescribing rates at T1, T2 and T3 People in the longitudinal cohort:Were 1.8 times more likely to take antidepressants over time (OR=1.78, 95% CI (1.43, 2.21))Were 2.5 times more likely to take hypnotics/anxiolytics over time (OR=2.54, 95% CI (1.83, 3.52))Were 1.2 times more likely to take antipsychotics over time (OR=1.19, 95% CI (0.98, 1.43)), however this was not statistically significantConclusionsThere was no statistically significant increasing trend in antipsychotic prescribing, but no reduction either. Antipsychotic prescribing is much higher than the rate of psychosisFindings from the cohort study show that people are not being withdrawn from antipsychotic drugs, although the cross-sectional samples’ results suggest that fewer new prescriptions are being initiated than in the pastThere was a significant increasing trend in hypnotic/anxiolytic and antidepressant prescribingIncreased antidepressant prescribing may mirror findings reported in general population studies which have reported 7.5-10% year on year increasesConcerted action is needed to reduce antipsychotic prescribing in line with good practice recommendations.Characteristics2004T1 N=12012006T2 N=6482014T3 N=4065GenderMaleFemale 677 (56.4%)524 (43.6%)353 (54.5%)295 (45.5%)2358 (58.0%)1707 (42.0%)AgeMean44 years46 years44 yearsLevel of learning disabilitiesMildModerateSevereProfoundNot known455 (37.9%)321 (26.7%)234 (19.5%)191 (15.9%)0256 (39.5%)188 (29.2%)117 (18.1%)86 (13.3%)0 1057 (38.5%)878 (32.0%)618 (22.5%)195 (7.1%)1317Table 1: Cross-sectional samples’ characteristics at T1, T2 and T3Table 2: Longitudinal cohort characteristics at T1, T2 and T3Characteristic2004T1 N=3682006T2 N=3682014T3 N=368GenderMale Female 196 (53.3%) 172 (46.7%)Level of learning disabilitiesMildModerateSevereProfound 161 (43.8%) 103 (28.0%) 59 (16.0%) 45 (12.2%)Mean age41 years43 years51 yearsLongitudinal cohort prescribing rates at T1, T2 and T3