

Dr Dan Rand Winona State University When it was a game not a poorly run business How was baseball designed Abner Doubleday in Cooperstown or Alexander Cartwright in Hoboken NJ Baseball is a beautifully balanced game ID: 318554
Download Presentation The PPT/PDF document "A Factorial Design for Baseball" is the property of its rightful owner. Permission is granted to download and print the materials on this web site for personal, non-commercial use only, and to display it on your personal computer provided you do not modify the materials and that you retain all copyright notices contained in the materials. By downloading content from our website, you accept the terms of this agreement.


Slide1
A Factorial Design for Baseball
Dr. Dan Rand
Winona State UniversitySlide2
When it was a game, not a poorly run business
How was baseball designed?
Abner Doubleday in Cooperstown, or Alexander Cartwright in Hoboken, NJ?
Baseball is a beautifully balanced game !Slide3
Look at balance of baseball that developed in 1800’s:
Distance to bases (infield single)
Catcher's throw to catch a base stealer
Diamond - why not pentagon or oval?
Irregular dimensions - home run fences
How many outs ?
How many strikes ?
How many bases ?
Foul ball areasSlide4
Baseball strategy is optimization
leftie vs. rightie (pitcher vs. batter)
Pitcher days between starts
Maximize runs - sacrifice, hit and run, swing awaySlide5
Balance through product modification
40 years of trial and error experimentation, then
Ball changed in Babe Ruth's time
Mound raised in 1968.Designated hitter in 1973.
Home run totals of 1996-2001Slide6
We could do it all in 1 experiment
If statisticians invented baseball instead of baseball inventing statisticians…
“Build it, and they will come”Slide7
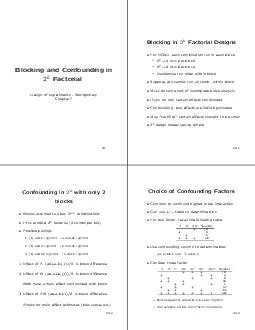
Baseball Design Factors
A - Infield shape/ number of bases - diamond, pentagon
B - outs - 3, 4
C-Distance to bases - 80 feet, 100 feet
D - foul ball areas - areas behind first, home, and third, or unlimitedE - strikes for an out - 2, 3
F - fences - short, long
G - Height of pitcher’s mound - low, highSlide8
Measurements
- trials are innings
# hits, walks, total bases
% infield hits (safe at 1B as % of infield balls in play)
% of outs that are strike-outs% of outs that are foul-outs
% caught stealing
%
baserunners
that score
total runsSlide9
How many innings ?
Test 7 factors (rules) one-at-a-time, say we need 16 innings at each level
16 x 7 x 2 (levels) =
224 innings
At what levels are the other 6 factors ?Full factorial experiment - every combo of 7 factors at 2 levels, 27 =
128
combos
Any factor has 64 innings at its low level, and 64 innings at its high levelSlide10
A full factorial gives info
about every interaction
Interaction = the phenomenon when the effect of one factor on a response depends on the level of another factor.Slide11
One trial of a full factorial
A - Infield shape= 5 sides, 5 bases
B - outs = 3
C-Distance to bases = 100 feet
D - foul ball areas = unlimitedE - strikes for an out = 3
F - fences = long
G - Height of pitcher’s mound = lowSlide12
The power of
fractional factorials
For 16 innings, each level, each factor: what can we get out of 32 innings?
Can't run every combination - what do we lose?
We can't measure every interaction separately.Slide13
The power of
fractional factorials
Needed assumptions:
3-factor interactions don't exist in this model
2 2-factor interactions can be pre-determined as unlikely to exist.Then we only need 32 of the 128 combinations
Let’s play ball !