
Objective of measures of dispersion 1 To judge the reliability of measures of central tendency 2To make a comparative study of the variability of two series 3 To identify the causes of variability with a view to control ID: 1022113
Download Presentation The PPT/PDF document "Dispersion is the measure of the variati..." is the property of its rightful owner. Permission is granted to download and print the materials on this web site for personal, non-commercial use only, and to display it on your personal computer provided you do not modify the materials and that you retain all copyright notices contained in the materials. By downloading content from our website, you accept the terms of this agreement.


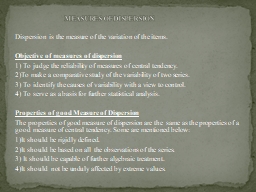
1. Dispersion is the measure of the variation of the items.Objective of measures of dispersion 1) To judge the reliability of measures of central tendency.2)To make a comparative study of the variability of two series.3) To identify the causes of variability with a view to control.4) To serve as a basis for further statistical analysis.Properties of good Measure of DispersionThe properties of good measure of dispersion are the same as the properties of a good measure of central tendency. Some are mentioned below:1)It should be rigidly defined.2)It should be based on all the observations of the series.3) It should be capable of further algebraic treatment.4)It should not be unduly affected by extreme values. MEASURES OF DISPERSION
2. Measures of Dispersion (or variability)a)Absolute Measures: Dispersion is expressed in terms of the original units of the series . (Example dispersion of series relating to income of a group is expressed in terms of rupees, the same unit as in original data.) Absolute measures of Dispersion are as follows:RangeInter-quartile rangeQuartile DeviationMean DeviationStandard DeviationLorenz Curve b) Relative Measure: Dispersion is measured as a percentage , or a ratio of the average. Relative measures of dispersion are as follows:Coefficient of RangeCoefficient of mean deviationCoefficient of quartile deviationCoefficient of variationDifferent Measures of Dispersion
3. It is the simplest measure of dispersion. It is the difference between largest and the smallest value in the series. Symbolically, RANGE = L-SWhere L is the largest value and S is the smallest value in the series.In case of continuous series , range is calculated by subtracting the lower limit of the lowest class from upper limit of the highest classCoefficient of Range: Since range is a relative measure of dispersion, which cannot be used for comparing two distribution expressed in different unit. This difficulty is overcome by using a relative measure. If the range is divided be the sum of the extreme items the resulting figure is called “ coefficient of range”. Symbolically, Coefficient of Range = L-S / L+S = ABSOLUTE RANGE / SUM OF THE EXTREME VALUESRANGE
4. The profit of a company for last eight years are given below. Calculate the range and its Coefficient.Solution:Here L =230 and S= 30 Range = L-S = 230-30 =200Coefficient of Range= L-S / L+S = 230-30 / 230+30 = 200/ 260 = 0.77Merit:Simple conceptEast to calculateDemerits :All observations are not considered.Affected greatly by fluctuations in sampling and extreme values.Cannot be used in case of open ended distribution EXAMPLEYear20102011201220132014201520162017Profit(in ‘000’)40308010012090200230
5. Inter Quartile Range (IR): = Q3-Q1 (Difference between third Quartile and first quartile)Semi Inter-Quartile Range or Quartile Deviation(QD) = (Q3-Q1)/ 2 Quartile Deviation is an absolute measure of dispersionAnd as such is not useful if we need to compare two distributions with different units. Coefficient of Quartile Deviation = (Q3-Q1)/(Q3+Q1)Example:Find the Quartile Deviation And its Coefficient from the following data relating to the daily wages of seven workers.Quartile DeviationDaily Wages50708060654090
6. Daily wages: 40,50,60,65,70,80,90Q1= the value of (N+1)/4 th item or (7+1)/4 or 2nd item =50Q3 =the value of 3(N+1)/4 th item or 3(7+1)/4 or 6th item =80Quartile deviation = (Q3 – Q1)/2 = (80-50)/2 = 30/2 = 15 Coefficient of Quartile deviation = (Q3-Q1)/Q3+Q1 =30/130 =0.23Discrete Series Calculate the Quartile Deviation and its Coefficient from the following data We need to arrange the wages in ascending order as belowWeight(Ibs)120122124126130140150160No. of students 135710211
7. Q1= the value of (N+1)/4 th item or (31+1)/4 th item or 8th item =124 IbsQ3= the value of 3 (N+1)/4 or3(31+1)/4th item or 24th item= 130 IbsQuartile Deviation = (Q3-Q1)/2 =(130-124)/2 = 6/2 =3IbsCoefficient of Quartile Deviation = (Q3-Q1)/Q3+Q1 =6/254 = 0.0236Continuous SeriesCalculate the semi inter-Quartile Deviation and Coefficient of Quartile Deviation from the following dataSOLUTIONMark0-1010-2020-3030-4040-5050-6060-7070-8080-90no. of students111825283330221522
8. Q1= the value of [N/4]th item or [204/4]th itemOr 51st item which is in 20-30 groupQ3= the value of 3[N/4]th item or 3[204/4]th item Or 153rd item which is in 60-70 groupThe value of Q1 = 28.80The value of Q3= 63.64Now ; sQuartile Deviation = (Q3-Q1)/2 = (63.64- 28.80)/2 = 34.84/2 = 17.42 marksCoefficient of Quartile Deviation = (Q3-Q1)/Q3+Q1 = 34.84/92.44=0.37Solution marks0-1010-2020-3030-4040-5050-6060-7070-8080-90No. of students111825283033221522Cf11295482112145167182204