
Lactobacillus plantarum Retrieved from Ren B et al Crystal structure of Tannase from Lactobacillus plantarum 2013 Journal of Molecular Biology 425 27372751 Enzymes in the Food Industry ID: 1012037
Download Presentation The PPT/PDF document "Figure. Stucture of tannase from" is the property of its rightful owner. Permission is granted to download and print the materials on this web site for personal, non-commercial use only, and to display it on your personal computer provided you do not modify the materials and that you retain all copyright notices contained in the materials. By downloading content from our website, you accept the terms of this agreement.


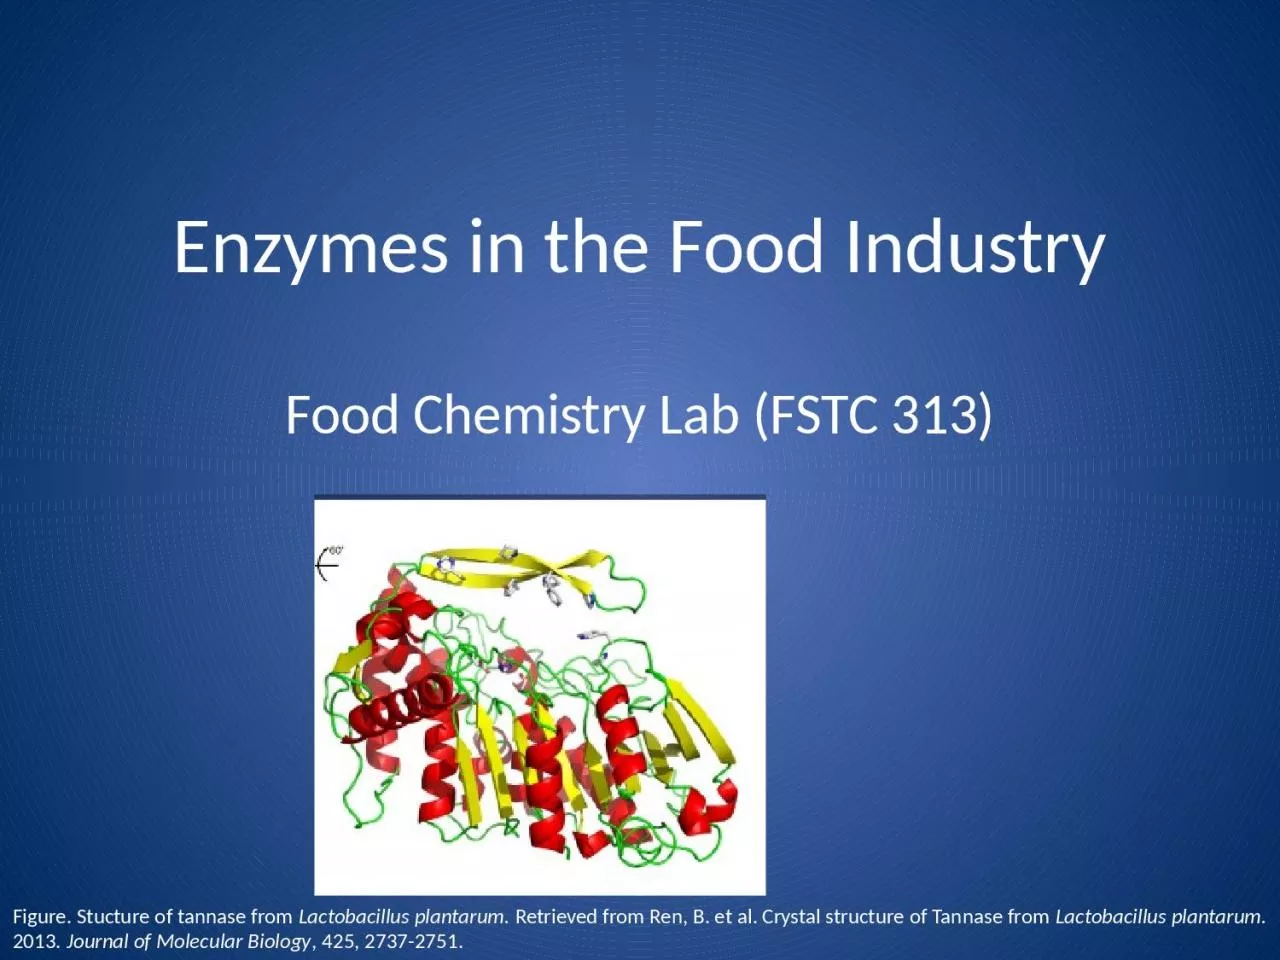
1. Figure. Stucture of tannase from Lactobacillus plantarum. Retrieved from Ren, B. et al. Crystal structure of Tannase from Lactobacillus plantarum. 2013. Journal of Molecular Biology, 425, 2737-2751.Enzymes in the Food IndustryFood Chemistry Lab (FSTC 313)
2. OutlineEnzyme Basics - Definitions - Factors to ConsiderEnzymes in Food ProcessingEnzymes and Food QualityExpectations for Lab #5 (Today) and Protein Lab Reports
3. What are Enzymes?Proteins that catalyze chemical reactions by lowering the activation energyIn other words…they make reactions go faster!
4. Factors to Consider with EnzymespHTemperatureConcentration Substrate and EnzymeSpecificityCofactors and Inhibitors
5. Example of Enzyme Info Sheet
6. Example of Enzyme Info Sheet
7. How do enzymes effect these food products?
8. FoodEnzymesBreadGlucose OxidaseMeatPapainBromelainCheeseChymosinBrowned ApplePolyphenol OxidaseBeerAmylaseProteaseJuicePectinaseCellulaseHemicellulaseHFCSAmylasePullulanaseGlucose IsomeraseTomato PastePolygalacturonasePectin Methyl Esterase
9. Enzymes in Food ProcessingEnzymes are used to improve food quality (Meat, Juice)Enzymes are used to speed up/control the production process (HFCS, Bread, Cheese)Natural enzymes from the raw material are manipulated during processing (Beer, Tomato Paste)Enzymes cause food quality issues (Citrus, Browned apples)
10. BrowningBrowning can be either desirable (caramel, bread crust) or undesirable (fruit and vegetables)Browning can be characterized as non-enzymatic (maillard, ascorbic acid) and enzymatic Polyphenol oxidase (PPO) is the major culprit of enzymatic browning in foodsMaillard (non-enzymatic) PPO (enzymatic)
11. How PPO Works
12. INTRODUCTIONBrowning:Fruits and vegetables EnzymaticNon-enzymaticOxidation of phenolic compoundsSensory properties- Color- FlavorBadGood
13. INTRODUCTION: PPOPolyphenoloxidase (PPO): Enzyme that catalyze browning reactionExamples: Apples, avocados, lettuce, potatoes QuinonesThe reaction:Soluble or Insoluble brown polymersCu+
14. INTRODUCTIONWhat factors determine rate of enzymatic browning?Concentration of available PPOConcentration of PhenolicspHTemperatureOxygen availability
15. INTRODUCTIONHow can we control the reaction?Ascorbates, bisulfites, thiols --- Reducing agents, Reduce quinone formationEDTA, Oxalic acid, Citric Acid --- ChelatorsCitric acid, malic, phosphoric acids --- Change pH of solution
16. Questions to get you thinking…Are there any foods where browning by PPO is desirable?Are all PPOs the same? For example, if I were to isolate PPO from 2 different vegetables would I get the same protein?Knowing what we know about enzymes and proteins, how can we inhibit their activity?Is it possible to stop this reaction without inhibiting the enzyme?
17. OBJECTIVESTo measure enzymatic activity and determine concentration dependence of an enzyme-catayzed reaction rate on substrate concentrationEvaluate influence of inhibitors
18. MATERIALPotato filtrateSubstrate: 20mM catechol dissolved in buffer5mM ascorbic acid dissolved in buffer
19. Method 2: Impact of InhibitorEffect of Ascorbic acid on PPO activityEach group will assay phenol oxidase activity in the presence of various concentrations of ascorbic acid, in duplicateMaterialVolume needed (mL)Catechol (mL)2.002.002.002.00Phosphate buffer (mL)0.900.880.820.58Inhibitor (mL):0.000.020.080.32Potato filtrate0.100.100.100.10Total volume (mL)3.003.003.003.00Lab Group #Observe browning based on scale of 1-10 visual rating
20. Results: Interpreting Plot the change in absorbance as a function of time, and determine the slope: + + SLOPES:- Abs/timeSLOPES =RateVelocity
21. Results: Interpreting Michaelis-MentenSlopes = Velocity – Plot a graph:X Y (V: abs/time)S4V4S3V3S2V2S1V1Y (V: abs/time)S4V4S3V3S2V2S1V1 Linearize
22. Results: Interpreting How can we work with this data?X Y (V: abs/time)S4V4S3V3S2V2S1V1Y (V: abs/time)S4V4S3V3S2V2S1V11/ 1/ VS4V4S3V3S2V2S1V11/ VS4V4S3V3S2V2S1V1 Michaelis-MentenLineweaver-Burlee
23. Results: Interpreting Lineweaver-Burlee:- From data: 1/ 1/ VS4V4S3V3S2V2S1V11/ VS4V4S3V3S2V2S1V1Y Where: y = 1/ V a=X = 1/ S b=
24. Results: Interpreting Example: - From data: V0.050.190.50.1991.00.19962.00.1998V0.050.190.50.1991.00.19962.00.1998Y 1/ 1/ V205.225.0215.010.55.0051/ V205.225.0215.010.55.005 - From data: choose a concentration from your data: S= 2.0 and V = 0.1998
25. Results: Interpreting - From M-M equation:
26. Results: Interpreting Michaelis-Menten KM and S : MolarityV: abs/ secSmall S: Slope is Vmax/KMLarge S: Saturation of enzymeV = Vmax
27. Visual observations:“Experiment” with the browning reactions and record your observations. Choose factors that you believe will influence therate of the reactionseverity of browningreversibility of the browningtiming of the reaction timing of reversibility of color
28. Visual observations:Expect to conduct MANY different observational trials, using about 10 mL of solution for each. Take your time and record all observations. You are on your own, so the more data you collect the better the discussion you can write. THINK about what you are doing before you do it. Create a hypothesis and experimentally test it.
29. Experimental ScreeningApplesPotatoesCitric AcidHydrogen PeroxideSodium SulfiteAscorbic AcidHClNaOHCitric AcidHydrogen PeroxideSodium SulfiteAscorbic AcidHClNaOH
30. Practical TrailsPlace Catechol solution on potato and apples, let sit for 10 minutesTake the solutions that helped inhibit browning in previous traiIs and treat potatoes and apples with 0.5 mL Record observations
31. Practical TrailsCompare apples/potatoes that were sitting out to apples/potatoes that were in an ice water bathCut the apples and potatoes into smaller pieces and observe the effectObserve if leaving the potatoes and apples out for longer periods of times prevents inhibition of browning
32. MaterialsCitric Acid – Chelator, organic/weak acidHCl – strong acidNaOH – strong baseHydrogen peroxide – pro-oxidantSodium sulfite – reducing agentAscorbic acid – reducing agentCatechol – polyphenolPotato/apples – source of PPO
33. Tool Box:A beaker and stir-bar for mixing.Buffers to control pHHydrochloric acid solution to modify pHCitric acid to modify pH and act as a metal chelatorPhosphates to act as metal chelatorsHydrogen peroxide as an oxygen sourceA hot plate to provide heatIce to provide coldAscorbic acid and/or sodium sulfite (inhibitor)Bentonite clay, as a protein binding agentSodium Borate (Borax) (inhibitor)