
GIS is a system designed to capture store manipulate analyze manage and present all types of geographical data Wikipedia maps data tools computers Geography is visualized in maps wwwarcgiscom ID: 1002502
Download Presentation The PPT/PDF document "What is GIS A geographic information sy..." is the property of its rightful owner. Permission is granted to download and print the materials on this web site for personal, non-commercial use only, and to display it on your personal computer provided you do not modify the materials and that you retain all copyright notices contained in the materials. By downloading content from our website, you accept the terms of this agreement.


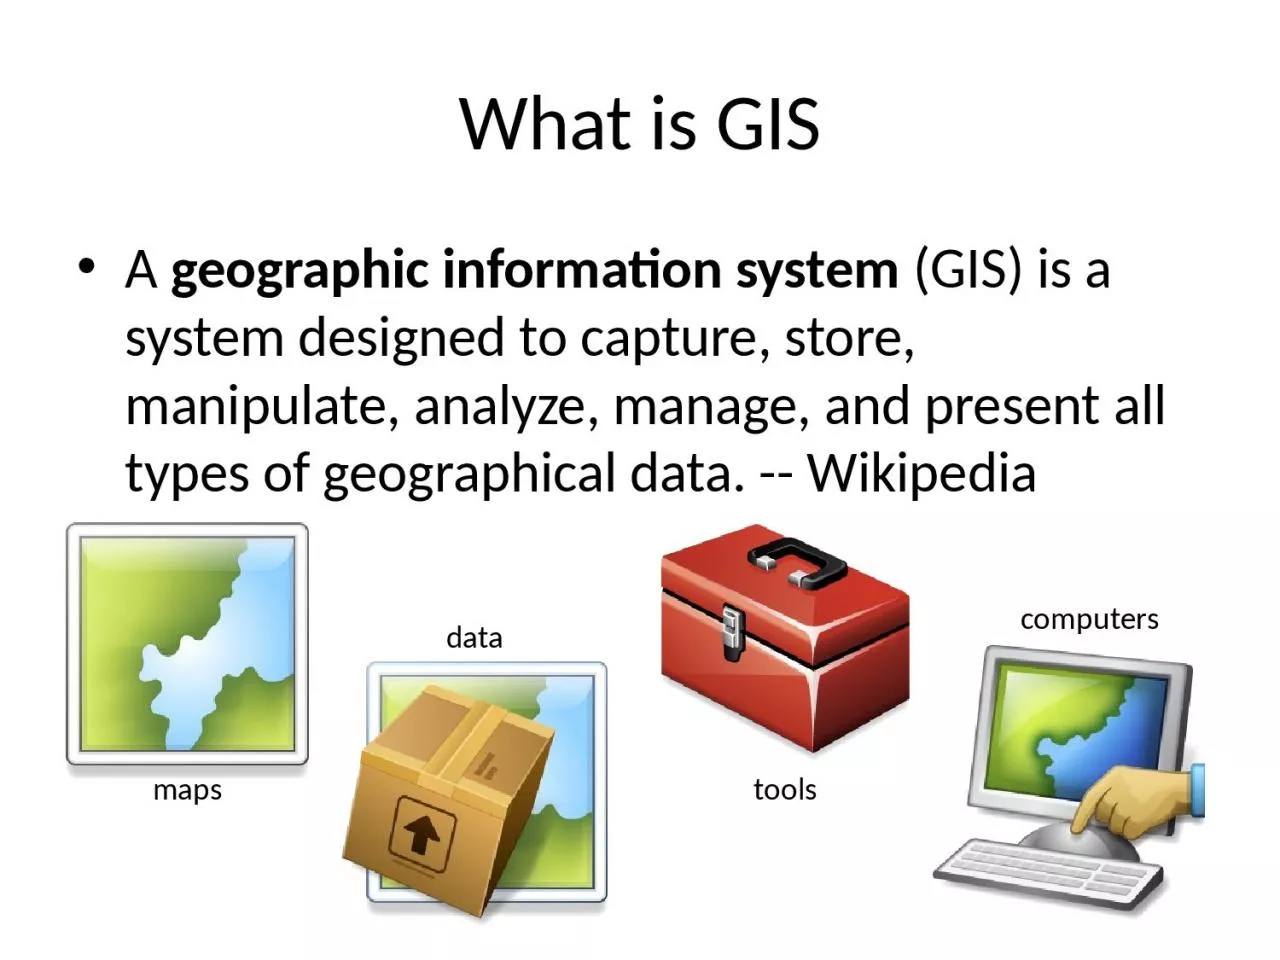
1. What is GISA geographic information system (GIS) is a system designed to capture, store, manipulate, analyze, manage, and present all types of geographical data. -- Wikipediamapsdatatoolscomputers
2. Geography is visualized in mapswww.arcgis.commap
3. Maps are built from data mapdataRoadName: E. Dean Keeton StType: Div HighwaySpeed: 35 mphShape: [Geometry]BuildingName: Ernest Cockrell Jr HallAddress: 301 E. Dean Keeton StShape: [Geometry]Shape includes the geometry of the feature and where it is located on earth
4. Vector data represent discrete featuresmapdatapolygonslinespoints
5. Raster data form a grid of cells or pixelsmapdata
6. More Raster Examplesmapdatarainfallelevationland use
7. There are many more data typesmapdatatriangulated irregular networkmultipatchannotationMartin Luther King Dr W
8. TIN on Dean Keaton StRLMCPE
9. TIN Points on Dean Keaton546.911547.2547.23546.91
10. Connected Map, Chart and AnimationTropical Storm Fernandhttp://www.msnbc.msn.com/id/26295161/ns/weather/
11. Geographic Data ModelConceptual Model – a set of concepts that describe a subject and allow reasoning about itMathematical Model – a conceptual model expressed in symbols and equationsData Model – a conceptual model expressed in a data structure (e.g. ascii files, Excel tables, …..)Geographic Data Model – a conceptual model for describing and reasoning about the world expressed in a GIS database
12. Data Model based on a collection of data themes
13. Spatial Data: Vector formatPoint - a pair of x and y coordinates(x1,y1)Line - a sequence of pointsPolygon - a closed set of linesNodevertexVector data are defined spatially:
14. Kissimmee watershed, FloridaThemes
15. Attributes of a Selected Feature
16. Raster and Vector DataPointLinePolygonVectorRasterRaster data are described by a cell grid, one value per cellZone of cells
17. http://srtm.usgs.gov/srtmimagegallery/index.htmlSanta Barbara, California
18. Origin of Geographic Coordinates(0,0)EquatorPrime Meridian
19. Latitude and LongitudeLongitude line (Meridian)NSWERange: 180ºW - 0º - 180ºELatitude line (Parallel)NSWERange: 90ºS - 0º - 90ºN(0ºN, 0ºE) Equator, Prime Meridian
20. Latitude and Longitude in North America90 W120 W60 W30 N0 N60 NAustin: Logan:(30°18' 22" N, 97°45' 3" W)(41°44' 24" N, 111°50' 9" W)
21. Map ProjectionCurved EarthGeographic coordinates: f, l(Latitude & Longitude)Flat Map Cartesian coordinates: x,y(Easting & Northing)
22. Earth to Globe to MapRepresentative FractionGlobe distanceEarth distance =Map Scale:Map Projection:Scale FactorMap distanceGlobe distance =(e.g. 1:24,000)(e.g. 0.9996)
23. Coordinate Systems(fo,lo)(xo,yo)XYOriginA planar coordinate system is defined by a pairof orthogonal (x,y) axes drawn through an originGeographic CoordinatesProjected Coordinates