
x0000x00001 How husbands and wives report their earnings when she earns more eggeness United States Census Bureau ESHD Working Paper 2018June 68 D Marta MurrayClose martamurrayclosecens ID: 845277
Download Pdf The PPT/PDF document "Manning up and womaning down" is the property of its rightful owner. Permission is granted to download and print the materials on this web site for personal, non-commercial use only, and to display it on your personal computer provided you do not modify the materials and that you retain all copyright notices contained in the materials. By downloading content from our website, you accept the terms of this agreement.


1 ��1 Manning up and womani
��1 Manning up and womaning down: How husbands and wives report their earnings when she earns more eggeness United States Census Bureau ESHD Working Paper # 2018June 68 D Marta MurrayClose: marta.murray.close@census.gov. Misty Heggeness: misty.l.heggeness@census.gov . 2 1 Introduction The desire to view or present oneself in a positive lightcan lead survey respondents to overreport socially favored, and underreport socially disfavored,attitudes, circumstances, and behaviors(Bound, Brown and Mathiowetz 2000)Complicating the relationship between social desirabilityconcerns and survey reporting behavior, a person’s identitymay influence what is socially favoredor disfavored. When a person selfidentifies or is identified by others as a member of a group, he or she is subject to set of havioral norms for that group. How well the person adheres to norms may affect the person’s own subjective sense of wellbeing and the sense of wellbeing of others(Akerlof and Kranton . This paper asks how a specific gendered identity norm of differentsex marriage that a husband should earn more than his wife affects measurement error in the reported earnings reports of husbands and wives in the Current Population Survey Annual Social and Economic Supplement (CPSASEC)Previous research showsthat this normis salient for couples in the contemporary United States.To start, evidence from nationally representative survey datasuggests that couples avoid arrangements where wives outearn their husband. Contrary to standard economic models of the marriage market, which allowthat the relative earnings of husbands andwives may influenceoutcomes but predict no distinctive behavior at the point when wives’ earnings surpass their husbands’a wife is more likely to earn just under half of a couple’s total earnings than she is to earn just over halfThis finding suggests that couples careabout being on the traditionalside ofthe equalearnings threshold, specifically,rather than or in addition to caring about the relative earnings of the spouses more generally. What is morethe possibility of being on the wrong side of the equalearnings threshold appears to deter couples from marrying andwives from working andearning up to their potential, while being on the wrong side of the threshold increasethe likelihood that couples divorce(Bertrand, Kamenica and Pan 2015)The evidencethat important decisions about work and family are affected by the norm that a husband should earn more than his wife suggests that survey responses may also be affected.some couples alter their realworld behavior to conform to the norm,thenit seems plausible that somealter their survey responsesto appear as if they conform.Contrary to this hy
2 pothesis, a review of research onmeasure
pothesis, a review of research onmeasurement error in surveyreported earnings concluded that “there is little evidence to support the existence of social desirability bias with respect to the reporting of annual earnings(Bound, Brown and Mathiowetz 2000, p. 53). But previous research has focused on the impact of a worker’s own characteristics on measurement error andhas not generally considered interactions between household members(see, for example, Bollinger 1998, Kim and Tamborini 2012, 2014). This paper shows thatsuch interactionsmatter:when a wife earns more than her husband, survey respondents are more likely than otherwise to underreport the wife’s earnings and overreport thehusband’s earnings. This pattern holds under both OLS and fixed effects estimation and regardless of whether the survey respondent for the couple is the husband or the wife. 2 Data: Matched survey and income - tax records This paper asks whether survey respondents describingmarriageswhere the wife earns more than herhusband (mis)reportearnings in a way that minimizes the couple’sviolation of the northat husbands earn moreTo answer this question, we need matched data on husbands’ and wives’reported and trueearnings.We obtaindata onhusbands’ and wives’reported earnings from the to 2013 ��3 &#x/MCI; 0 ;&#x/MCI; 0 ;samplesof theCurrent Population Survey Annual Social and Economic Supplement (CPSASEC). The CPSASECis a householdbased survey thatprovides nationally representative data on theincome, employment, and demographic characteristics oftheU.S.civilian noninstitutionalized population.The survey identifiesrelationships between household members, including husbands and wives, allowing us to construct a nationally representative sample of married couplesnterviewers administer the CPSASEC questionnaireto adult members of sampled households either in person or by telephone. In most cases, a single householdrespondent completes the questionnairefor all household members. The household respondent for a married couplein the CPSASECmay bethe husband, the wifeor another adulthousehold memberTo distinguish between the couples in our analysis sample and the household respondents who provide information about them, we refer to the householdrespondents asvey respondents and to the couplesas surveysubjectsWe obtain data on husbands’ and wives’“true”earnings from the Social Security Detailed Earnings Record (DER).The DERcontains administrativerecordof individual incomereported by employers to the Internal Revenue Service(IRS) on W2 forms. For each tax yearbeginning in 1978, it contains workers’earningsfrom all jobs with W2 filings, as well as selfemployment i
3 ncomecovered by either theFederal Insura
ncomecovered by either theFederal Insurance Contributions Act (FICA) the SelfEmployment Contributions Act (SECA).We matchthe survey recordsof CPSASEC survey subjectsto their DER administrativerecordsusing a unique individual identifier called a Protected Identification Key (PIK). TheCensusBureau attempts to assign a PIK to each survey record and each administrative record through its Person Identification Validation System (PVS), which uses key identifiers like name, date of birth, and street address, to match the survey or administrative record to a record in areference file that containsPIKs. Typically, the PVS successfully assigns a PIKto between 90 and 93 percent of survey records and 98 percent of administrative records(Mulrow, et al. 2011)We match each survey record in our CPSASECsample to any DER administrative records that sharethe samePIKWe constructour CPSASEC and DER earnings measuresto maximize their comparability. ecause the reference year for the CPSASEC income questions is the calendar year before the survey, we match CPSASEC earnings reportsfrom each survey yearwith DER earnings records from the preceding calendar/tax year (for example, CPSASEC earnings reports from survey year 203, which describe earnings from calendar/taxyear 202, are matched with DER earnings records from calendar/tax year . Thenausethe DER does not capture selfemployment income that is not taxable underFICA or SECA, we exclude selfemployment income from both earnings measures. Our CPSASECearningsmeasure fora given survey subjectin a given year is the total wage and salary incomethe household respondent reported the subjectearnedin thatyear. Our DER earnings measureforthe same survey subjectin the same yearis the total wage and salary income(the sum of wages, tips, and deferrecompensation) from all jobs with W2 filings for that subjectin thatyearThere are many reasons why earnings reported in a survey may differ from earnings reported to tax authorities, and survey recordsmay be more accurate than tax records in some cases (for example, earnings from informal work may be reported in a survey but not to tax authoritiesIn the case of earnings misreporting due to social desirability concerns, however, it seems likely that tax records are largely accurate, while survey records may be less so. Given that employers submit W2 forms for their employees directly to the IRS, would be difficult for workers, their spouses, or their housematesdistort the earnings recorded for workersin the DERIn contrastCPSASECrespondents may feel some pressure to give socially desirable answers when interacting with an interviewerand ould easily distort the earnings recorded for workers inthe surveydataThus, for purposes of estimating the effect of ��
4 00;4 &#x/MCI; 0 ;&#x/MCI; 0 ;ma
00;4 &#x/MCI; 0 ;&#x/MCI; 0 ;marital nder norms on earnings reporting, it seems reasonable to treat ourDER earnings measure as a measure of true earningsand to treat differences between our CPSASEC and DER earningsmeasureas survey misreportingA limitation oftreating our DER earnings measure as a measure of true earningsis thatpeople whoearned nothing in a given year shouldnot have a DER record forthat year, so we cannot use the DER records aloneto identify true nonearners.This limitation would not be a problem if we restrictedour analysis sample to couples wherethe true earnings of both partners were positive, but we wish to study the reporting behavior of earners inboth dualand singleearner couples. Instead, wassume that a surveysubjectwas a true nonearnerin a given yearif (1) the household respondent reported that the subjectwas not employed in that year(2) the subjectwas assigned a PIK so that a link between the subject’sCPSASEC and DER records could beattempted, and (3) despite having a PIKthe subjectlackeda linked DER record for theyear(which, given the very high proportion of DER records with PIKssuggests that the subjectdid not have any2 filings fortheyearWe construct our analysis sample from thepooledCPSASEC sample. The CPASEC is a short panel survey: sampled households are in the survey for four months, out for eight, and then in again for another four. Consequently,couples who remain at the same address may complete the surveyin two adjacent years. ur analysis sample includes observations of differentsex married coupleswhose marriages meetthe following criteriain the calendar year before their surveyFirst,both spouses mustbetween 25 and 54 years oldSecondat least one spouse must workor pay. Third, because our earnings measures exclude selfemployment income,any spouse who worksfor paymust havetheir primary job (the job they held longest during the survey reference year) withprivatesector or government employer. Thislast requiement excludecouples where one or both spouses areprimarily selfemployed. We refer to the observationsthat meet these substantive sampleselection criteria thebaseline sample.The baseline sample containsapproximately observations of approximately couples (throughout the paper, reported sample sizes are rounded according to the Census Bureau’s disclosure avoidance requirements)We deriveour analysis sample from thebaseline sample by excluding observations with missing, imputed, or inconsistent earnings data. To start,excludeobservationsof couples wherea working spouse hasimputed CPSASEC earningsThe Census Bureau imputes missing earnings in the CPSASECusing a hotdeck procedure that assignsto each personwithout reported earnings the earningsof a donor with similar characterist
5 ics. Including observations withhotdecke
ics. Including observations withhotdecked earnings inwage regressionshas beenshown to cause match bias,a form of attenuation bias, in the coefficients on variables not used to select donors(Bollinger and Hirsch 2006, Hirsch and Schumacher 2004)Since the earnings of a person’s spouse relative to the person’s own earnings are not used to select donors in the Census Bureau’s hotdeck procedure, including observations with imputed earnings in our analysis sample would increase the probability that we fail to detect an effect of higherearning wives on earnings reporting, should such an effect exist. bservationsexcluded forimputed CPSASEC earningcomprisepercent of thebaseline sample Next, weexclude observations couples whereone or both spouses lacksa PIK, since the CPSASECrecords of surveysubjectswithout PIKscannotnot belinked to their DER records. bservations excluded formissingPIKscomprisepercent of the baseline sample. We also exclude observations couples wherea working spoushasa PIK but lacksa linked DER record because we cannot determine the trueearnings of these spouses. bservations excluded for missing DER recordscomprisepercent of thebaseline sample.o focus on earningsmisreporting that might plausibly be attributed to social ��5 &#x/MCI; 0 ;&#x/MCI; 0 ;desirability concerns, we excludeobservationcouples who exhibit extreme misreporting. Specifically, we exclude observations of couples wherea working spouse haa gap of more than 100 percent between his or her CPSASEC earnings and his or her DER earnings. bservations excluded forextreme misreporting comprisepercent of the baseline sample. Finally, because the CPS sample design generally precludescouples from participating in the CPSASEC in more than two years or in nonconsecutive years, we exclude observations of couples who appear, based on their PIKs, tohave done . bservations excluded for nonstandard participationsequences comprisepercent of the baseline sample. After applyingtheadditional sampleselection criteria, our analysis sample includespercent of the observations in thebaseline sampleand containsapproximatelyobservations approximately couplesWith the CPSASEC personlevel sampling weightswhich are identical for husband and wives, thebaseline sample is approximately representative ofsingleand dualearner married couplesin the U.S. between 2003 and 2013with both spousesbetween 25 and 54 years oldand not primarilyselfemployedin the preceding calendar year.ur analysis sample, howeverexcludespercent of the observations in thebaseline sample.To prove the representativeness of our estimates, we adjust the CPSASEC sampling weightsfor the probability thatan observation is in the analysis sample, conditional on being in the baseline sam
6 pleSpecifically, we take couples as our
pleSpecifically, we take couples as our unit of analysis andusethecoupleyear servations in the baseline sample toestimate a logit modelpredicting the probability thatan observationin the baseline sampleis also in the analysis sample. The predictor variables aredemographic characteristicsage, race, citizenship status, and educational attainmentof the husband and the wife, whether eachspouse worked in the last calendaryearthe couple’sregion of residence,whether they lived in a metropolitan area, and the year of their CPSASEC interviewWe multiply the CPSASEC sampling weight for the husbandand wifeyear observationthat make upeach coupleyear observation by the inverse of the latter’spredicted probability of being in the analysis sampleSome of the analyses in this paperexploit the panel structure of the CPSASEC, and we make several adjustments to our data to facilitate these analysesFirst, because race is commonlyconceptualized as a timeinvariant variableand is timeinvariant for all by a small number of people inour analysis sample, we create a timeinvariant race variable that takes the value of the race reported for a person in the first year they appear in the sampleSecond, because couples’ region of residence is empirically so close to timeinvariant that it cannot be included in our fixed effects analyss, walso create a timeinvariant region variable.Finally, because our fixed effects analysis requirethat the sampling weights for husbands and wivesconstant over time, we createtimeinvariant persolevel sampling weight. For consistency, we use he timeinvariant race and regionvariablesand the timeinvariant sampling weightsin all of our analyses. Where couples are our unit of analysis, we use the sampling weights for wives(which, like the unadjusted CPSASEC personlevel sampling weights, are identical to the sampling weights for their husbandsas the sampling weights for couples. 3 Variable means : How couples with higher - earnings wives are different Wedivide the couples in our analysis sample into two groups based on their DER earningscoupleswhere the wife earns more thanthe husband and couples where she does not. We refer to the former as nontraditional couples and the latter as traditionalcouples(As explained above, some couples in our analysis sample are observed twice, so the number of observations in the analysis sample is greater than the number of couples. In this section and subsection5.1and 5.3we treat the data as a pooled cross ��6 &#x/MCI; 0 ;&#x/MCI; 0 ;section, and for ease of exposition, we refer to observations simply as couplesrather than coupleyears or observations of couples.) Consistentwith the results of previous research(Winkler, McBride and Andrews 2005)percent of
7 the couplesin our analysis sample are no
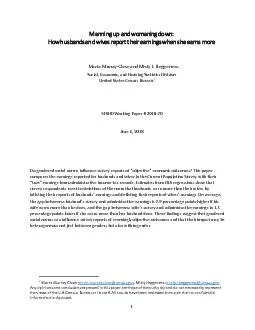
the couplesin our analysis sample are nontraditional. Our measure ofearnings misreporting for employedhusbands and wivesthe“reporting gapdefined as thedifference between husband’s or wife’sCPSASEC earnings andDER earning, expressedas aproportion DER earnings: reporting gap = (CPS earnings DER earnings)/DERearningsFigureshows the meanreporting gapfor employed husbands and wives in traditionaland nontraditional couples. Because measurement error in survey earnings is a decreasing and possibly nonlinear function of administrative earnings(Bollinger 1998, Kim and Tamborini 2012, 2014), we compute the mean reporting gapsseparately for workersin each decile of the overall DERearnings distribution. The results in Figuresuggest that household respondents for traditionalcouplesbehave similarly whether they are reporting the earnings ofhusbands or wives. The mean reporting gaps for traditional husbands are similar to those for traditional wivesacrossmost ofthe earnings distributionIn contrast, respondents for nontraditional couples inflate thesurveyearnings of husbands relative tthose of wives. The mean reporting gaps for nontraditional husbands are higher(more positive or less negative) than those for nontraditional wivesvalue from Wald test for difference in means 0.05 in each decile. difference in the reportingbehavior of household respondents by couple typereflects both higher reporting gaps for nontraditional husbands compared withtraditional husbands and lower reporting gaps for nontraditional wives compared with traditional wivesvalue from Wald test for difference in means .05 for each comparison in each decile but the firstThe patterns in Figureare suggestive evidencethat CPSASECrespondents react to violations of the norm that husbands outearntheir wives by inflating their reports of lowerearning husbands’ earnings and deflating their reports of higherearning wives’ earningsThe conclusions we can draw from these patterns are limited,however, becausethe estimates in the figuredo not accountfor characteristics other than true earningsthat may differ between traditional and nontraditional couples and may be correlated with earnings misreportingIndeed, we find that nontraditional couples differ from traditional couplesin several potentially important respects.Figure shows estimates of the mean values of selectincome and demographic variables fortraditional and nontraditional couples.Not surprisingly, given that nontraditional wives outearntheir husbandsbut crucially, given the knownrelationship between true earnings and earnings misreportingthe mean DER earningsof nontraditional wives are more than double those of (employedtraditional wives, while the mean DER earnings of employednontraditional husba
8 ndsare less than half those of tradition
ndsare less than half those of traditional husbands. similar pattern holds for educational attainmentnontraditional wives are aroundpercent more likely than traditional wivesto have a college degree, while nontraditional husbands arearound20 percent less likely than traditional husbands to have oneTurning to race and ethnicity, ntraditionalcouples (both husbands and wives) are almost twice as likelyas traditional couplesto be blackomparisonsfor other racialethnic groups, omitted for brevityshowedonly minor differencecouple typeFinally, nontraditional wives are slightly less likely, and nontraditional husbands slightly more likely, to be the CPSASEC respondent for their householdvalue from Wald test for difference in means .05 for each comparison The estimates in Figure also suggest that traditional and nontraditional couples are similar along somedimensions where wemight expect them to differ. In particular, whilewemight expect nontraditional couples to be concentrated in socially and politically liberal areas, theyare not meaningfully morelikely than traditional couples to live in citieswhich tend to be relatively liberalor the South, ��7 &#x/MCI; 0 ;&#x/MCI; 0 ;which tento be relativelyconservativeAnd while we might expect nontraditional couples to be younger than traditional couplesthey are in fact similarin age. 4 Regression results: Manning up and womaning down 4.1 OLS results : How earnings reporting differ s between couples with tra ditional and non - traditional marital earnings To determine whether earnings reporting for nontraditional couples in the CPSASEC differs from reporting for traditional couplesnetof observable differences between thegroupswe compare the reporting behaviorof respondents for nontraditional husbands and wives with the behavior of respondents for traditional husbands and wives, controlling for a host of husband, wife, and uplecharacteristics. Specifically, we estimatelinear probability and ordinary least squares (OLS) regressionof the form = + ���� + ����� + + ��� × ( ����� + ) + . ( 1 ) In the linear probability regressions, theoutcome variable, , isan indicator variable that equals one if person hasa positive reporting gap(that is if the earnings reported for person in the CPSASEC exceedthe earnings recorded for person in the DERIn the OLS regressionsthe outcome variable isthe reporting gap between the personCPSASEC andDER
9 earnings,as defined aboveBecause these o
earnings,as defined aboveBecause these outcome variables are not defined for people withoutearnings, we restrict our estimation samplefor equation to the employed husbands and wivesin our analysissample���is an indicator variable that equals one if person is a husband�����is an indicator variable that equals one if person has nontraditional marital earnings(that is, if person outearnher husband or is outearned by his wifeis a vector of characteristics of person , his or her spouse, and theirmarriage. For both person and his or her spouse, containsage in fiveyear bins, race (white, black, Hispanic, Asian, or another race), educational attainment (lessthan high school, high schooldegree, somecollege, college degree, or more than college), and a cubic polynomialin the natural log of DER earnings. Following Bertrand, Kamenica, and Pan (2015), we set the natural log of the spouse’s DER earnings to zero if the spouse is not employed and add to an indicator variable that equals one if the spouse not employed.For the couplecontains their standard Census geography regionNortheastMidwestSouth, orWest), whether they livein a metropolitan area, the natural log of theirtotal DER earnings, and whether their CPSASECrespondent was the husband, the wife, or another adultresponding for the household. Because we are interested in the specific effect of a wife outearning her husband rather than the general effect of a wife having high relative earnings, also includes the wife’s share of thecouple’s total earnings.We interact���with each of the other regressorsto allowthe effectof own, spouse, and couple characteristics on earnings reporting to differ bysurveysubjectgender. As a resultestimated differencesin earnings reporting between husbands and wivesmaydepend on these characteristics. To determinewhether surveysubject geer affects earnings reporting fortraditional(or nontraditional) coupleswe estimate the average marginal effect of being maleon subject’sreporting gaphenall subjects are treated as traditional(or nontraditional)Consistent with the descriptive results in Figure the average marginaleffectof surveysubjectgender on earnings reportingin the CPSASECis substantively negligible and statistically nonsignificantfor members of traditional couplesIn contrast, and also consistent with the descriptive results, the effect is both substantively and statistically ��8 &#x/MCI; 0 ;&#x/MCI; 0 ;significant for members of nontraditional couplesn averageestimatesFigure suggest thattreating a CPSAS
10 EC subject like nontraditional husband v
EC subject like nontraditional husband versus a nontraditional wifeincreasesthe probability that the subject hasa positive reporting gap by percentage points andincreases he value of the subject’sreporting gap by percentagepointsTo determine whether the gender gap in earnings reporting for nontraditional couplesis due to householdrespondents inflating the earnings of nontraditional husbands, deflating the earnings of nontraditional wives, or both, we estimate four additional parameters. First, for each of the two outcome variables, we estimate themarginal effect being nontraditional on the reporting gapforwivesThis effect is given byequation Second, we estimate themarginaleffect of being nontraditional on the reporting gaforhusband. This effect is given by Figure shows these estimates.onsistent with the descriptive results in Figure household respondents report lower earnings for wives whoutearntheir husbands and higher earnings for husbands whose wives outearnthem than they report for comparable wives and husbands with traditional marital earnings. average, earning more than her husbanddecreases the probability that wife has a positive reportinggapby percentage points and decreases the value of herreporting gap by percentage points. Earning less than his wife increasestheprobability that husband has a positive reporting gap by percentage points and increases the value of hisreporting gap by percentage points. 4.2 Fixed effects results : How earnings reporting change s when couples switch between traditional and non - traditional marital earnings The OLS estimates presentedaboveindicatethat, controlling for observdifferences between traditional and nontraditional couples, and taking the reporting gapsof traditionalcouples as a baselineCPSASECrespondents overreportthe earnings ofnontraditional husbandsand underreportthe earnings of nontraditional wives. These patterns may reflect efforts (either conscious or unconscious) by respondents to portray couples in a socially desirable manner. But the patterns may alsobe spurious: the apparent (and apparently gendered) effectof nontraditional marital earnings on earningsreporting may be driven by unobserveddifferences between traditional and nontraditional couplesAs a partial solution to this problemwe turn tofixed effects estimation, which allows us to control for stableunobserved differencesbetween couplesAn earlier study of couples withnontraditional marital earnings found that a sizable fraction transitioned into or outof this classificationover a twoyear period(Winkler, McBride and Andrews . Consistent with this finding, percent of the couples who appear twice in our analysis sampleand percent of the couples who appeartwice and are classified asnontraditio
11 nal at least oncechange classificationsb
nal at least oncechange classificationsbetween thefirst and second years we observe them. We use this withincouple variation in the classification of marital earnings to compare earnings reporting for husbands and wives when they areclassified as nontraditional with earnings reporting for the same husbands and wives when theyare classified as traditional. irst, we identify the husbands and wives in our analysissample who change classifications between the firstand second years we observe them and who are employed in both years(so we can observe their reporting gaps under both classifications). The, weestimatesexspecific fixed effectsregressions of the form = + ������ + + + . ( 2 ) The fixed effectin equation captures(observed and unobserved)timeinvariant characteristics of person , his or her spouse, and their marriageThe other variables are defined as equation , except ��9 &#x/MCI; 0 ;&#x/MCI; 0 ;thatour measures of race, regionand metropolitan residencewhich are timenvariant, drop out ofthe vectorThe parameter of central interest is , which gives the marginal effect of nontraditional marital earningson the reporting gapof husbands or wives. Figure shows estimates of for both husbands and wivesContrary to the concern that the gendered pattern in theOLS estimateswas driven byunobserved heterogeneity, thesame pattern appears in the fixed effects estimates. Indeed, the pattern is amplified rather than attenuated under fixed effects: the estimates Figure are consistently larger in magnitude than the corresponding estimates in Figure . More specifically, the estimates in Figure suggestthatamong couples who change martial earnings classificationscontrolling for both observedcharacteristicsnd stableunobserved characteristicsearningmore than her husband decreases the probability that a wife has a positive reporting gap by percentage points and decreases the value of her reporting gap by percentage points. The estimates alsouggest that earning less than his wife increases the probability that a husband has a positive reporting gap by . percentage points and increases the value of his reporting gap by percentage points.Why might the gendered effectof nontraditional marital earnings appearmore pronounced under fixed effects than OLS? One possible explanationis that the social norm that husbands outearntheir wives may beespecially salient for couples who have recentlyswitchedfrom traditional (normconformingto nontraditional (normviolatingor vice versaAn alternative explanationthatcouples who have recently switched from traditional to nontraditionalmay bemore likely than other couples to ha
12 ve experienced an increase in the wife&#
ve experienced an increase in the wife’s earnings or a decrease in the husband’s earnings. If survey respondents err in the direction of survey subjects’past earnings when reporting their current earnings, then changes of this kind couldlead respondentsoverreport the earnings of newly nontraditional wives and underreport the earnings newlynontraditional husbands. The reverse would be truefor couples who have recently switched from nontraditional to traditional. In any case, the fact that the fixd effects and OLS estimates showthe same gendered patternmitigates concerns that thepatterndue solely to unobserved heterogeneity or is solely an artifact of incomplete updating in surveyreported earnings 4.3 The role of proxy reporting: Does it matte r if the household resp ondent for a couple is the husband or the wif e? As explained above, the earnings of each couplein the CPSASEC are reported by a single household respondent. This respondent may be the husband, the wife, or another adult who lives withthem.The estimates presented above controlled for the identity of the household respondent, but they assumed that husbands, wives, and other household respondents react the same way to nontraditional marital earnings. There areat least tworeasons to think this assumption might be wrong.First, men may be more invested than women in traditional gender roles. Pooled data from the 2002 to 2012 samples of the General Social Survey show that, among men and women between the ages of 25 and 54uring the period covered by ourstudy, 26 percent of women but just 15 percent of men strongly disagreed that “It is much better for everyone involved if the man is the achiever outside the home and the woman takes care of the home and family” (authors’lculationsweighted data 416value from Wald test for difference in means .001Secondmen and women may differ, on average, in their knowledge of each other’s earningsConsistent with this idea(and also withfirst one), previous research withdata from the Current Population Survey’s utgoing ��10 &#x/MCI; 0 ;&#x/MCI; 0 ;Rotation Group filesfound that proxyreported wages were lower than selfreported wages, on average, and that the difference was larger for men than for women (Reynolds and Jeffrey 2012)aken together, hese observations suggest that the gendered effect of nontraditional marital earnings on earnings reporting may be larger when the household respondent for a couple is thehusband than when thehousehold respondent is thewife.To determine whether husbandrespondents react differently than wiferespondents when wife outearns herhusband, we stratify the estimation sample from section4.1the subsample ofemployed husbands and wives in
13 our analysis sample)by the identity of tby the identity of t")
our analysis sample)by the identity of the householdrespondent(husband, wife, or another household adult) and the identityof the survey subject (husband or wife)We drop observations where the household respondent for a couple is neither the husband or the wifebecause there are too few of these observationsanalyze separately. Then, for each combination of surveyrespondent sex and surveysubject sex, we estimate an OLS regressionof the form = + ������ + + , ( 3 ) where allof the variables are defined as in equation As in equation , thparameter of central interest is , which gives the marginal effect of nontraditional marital earnings on the reporting gapFigure shows estimates of when wives respond for wives, when wives respond for husbands, when husbands respond for wives, and when husbands respond for husbandsThese estimates are not entirely consistent with the prediction that husbandrespondentsreact more strongly than wiferespondents when a wife outearns herhusband. Instead, the estimates in Figure suggest a more nuanced pattern. oth husbandrespondents and wiferespondents appear to contribute to the pattern revealed by our earlier anayses: both inflate the earnings of nonraditional husbands relative totraditional husbands, and both deflate the earnings of nontraditional wives relative to traditional wivesexpectedhusbandrespondents deflate the earnings of nontraditional wives more than wirespondentsBut contrary to our expectations, husbandrespondents inflate the earnings of nontraditional husbands lessthan wiferespondentsAll differences between thesurveyreportingbehavior of husbandrespondents and wiferespondents are statistically significant at the 5percentlevelexceptthe difference in the effect of nontraditional marital earnings on the value of the reporting gap, which is significant at the 10percent levele can only speculate about whyhusbandrespondents and wiferespondents distort the earnings of their spouses more than their own earningswhen their earnings are nontraditional. Onepossible reasonis that social norms interact with knowledgeWhen a wife outearns her husband, both the husband and the wife may be uncomfortable or believethat an interviewer willbe uncomfortable with their violation of the malebreadwinner norm.Accordingly, they may be tempted to inflate their reports of the husband’s earnings and deflate their reports of the wife’s earningsAt the same time, both the husband and the wife may wish to provide accurate responses to the survey.To the extent that thedesires for normconformity and accurate reporting conflict, accurate reporting may win out more often whenrespondents are fair
14 ly certain of the answer to a survey que
ly certain of the answer to a survey questionas they are likely to bewhen reporting their own earnings) than whey less are less certain (as they may be whenreporting their spouse’s earnings). 5 C onclusions Annual earnings areessential measure of economic wellbeing. Our empirical results suggest thatsurveyreported wage and salary earnings in the CPSASECmay be biased by social desirabilityconcerns. ��11 &#x/MCI; 0 ;&#x/MCI; 0 ;When married couples in the CPSASEC violate the norm that husbands outearn their wives, the survey respondents reporting the couples’earningappear to minimize the violation by inflating the earnings of the lowerearning husbandand deflating the earnings of the higherearning wivesThis pattern persists when controlling for an array of demographic characteristics and the “true” (administrative) earnings of the spouses. It also persists when controlling for stable unobservable characteristics of the spouses and regardless of whether the survey respondent for the couple is the husband or the wife.One lesson fromthese findings is that survey reportsof even seemingly objective, clearlymeasurableeconomic outcomes may suffer from measurement error due not just to gaps in respondents’ knowledge of the outcome but also to gaps between their beliefs or values and the circumstancesthey are asked to describe.A more nuanced lesson from our findings is that the impact of gender on survey measurement error cannot be reduced to the gender of survey subjects aloneIt is not the case, for example, that CPSASEC respondentsexaggerate the earnings of husbandsin generalrelative to those of wives. hen respondents are asked to report the earnings of traditional couples (couples where the husband earns at least as much as the wife), the measurement error in theirreportsfor husbands statisticallyand substantivelyindistinguishable from the measurement errorin theirreports forcomparable wivesIt is only when respondentsare asked to report the earnings of nontraditional couples (couples where the ife outearns the husband) that the patterns of measurement errorin their reports for husbands and wives divergeA closely related point is that measurement error in survey responses about a given survey subjectmay depend not just on the characteristicsof the subject him or herselfbut also on the characteristics of other household members.Our results suggest that CPSASEC respondents (consciously or unconsciously) comparethe earnings of husbands with the earnings of their wives and that they report he earnings of both spousesdifferently when the comparison favors the wife. In this way, the reported earnings of husbands depend on their own earnings relative to the earnings of their wives, an
15 d vice versa.The tendency of survey resp
d vice versa.The tendency of survey respondents to compare the earnings (or other characteristics) of husband with those of their wives may be especially pronounced in the CPSASEC, where a single respondent answers survey questions about multiple household members in succession. The gendered pattern of measurement error described in this paper might be attenuated or absentin surveys like the Survey of Income and Program Participation that attempt to obtain responses from each survey subject directly. 12 References Akerlof, George A., and Rachel E. Kranton. 2000. "Economics and Identity." Quarterly Journal of Economics115 (3): 715Bertrand, Marianne, Emir Kamenica, and Jessica Pan. 2015. "Gender Identity and Relative Income Within Households." Quarterly Journalof Economics130 (2): 571Bollinger, Christopher R., and Barry T. Hirsch. 2006. "Match Bias from Earnings Imputation in the Current Population Survey: The Case of Imperfect Matching." Journal of Labor Economics24 (3): 483Bollinger, Christopher R. 1998. "Measurement Error in The Current Population Survey: A Nonparamteric Look." Journal of Labor Economics16 (3): 576Bound, John, Charles Brown, and Nancy Mathiowetz. 2000. Measurement Error in Survey Data.Population Studies Center Report No. 00450, Ann Arbor: University of Michigan.Hirsch, Barry T., and Edward J. Schumacher. 2004. "Match Bias in Wage Gap Estimates Due to Earnings Imputation." Journal of Labor Economics22 (3): 689Kim, ChangHwan, and Christopher R. Tamborini. 2012. "Do Survey Data Estimate Earnings Inequality Correctly? Measurement Errors Among Black and White Male Workers." Social Forces90 (4): Kim, ChangHwan, and Christopher R. Tamborini. 2014. "Response Error in Earnings: An Analysis of the Survey of Income and Program Participation with Matched Administrative Data." Sociological Methods and Research43 (1): 39Mulrow, Edward, Ali Mushtaq, Santanu Pramanik, and Angela Fontes. 2011. Assessment of the U.S. Census Bureau's Person Identification Validation System.NORC, University of Chicago.Reynolds, Jeremy, and Wenger B. Jeffrey. 2012. "He Said, She Said: the Gender Wage Gap According to Self and Proxy Reports in the Current Population Survey." Social Science Research41 (2): 392Winkler, Anne E., Timothy D. McBride, and Courtney Andrews. 2005. "Wives Who Outearn Their Husbands: a Transitory or Persistent Phenomenon for Couples?" Demography42 (3): 523 13 Figures Figure Meanreporting gapbetween survey and administrativeearningsacross the administrative earnings distribution, by sex and marital earningsclassificationof survey subjecturce: Current Population Survey Annual Social and Economic Supplement (CPSASEC) from survey years 200to 2013linked to Social Security Detailed Earning Record (DER) from
16 tax years 2002 to 2012Notes: Reporting
tax years 2002 to 2012Notes: Reporting gap = PSASEC earnings DER earnings)DER earningsMarital earningsare nontraditional if the wife’s DER earnings exceed the husband’s DER earnings and traditional otherwise. The estimation sampleobservations of employed husbands and wives from the analysis sample described in section . It containsapproximately 71,500observations of traditional wives, 101,000observations oftraditional husbands, 30,000observations of nontraditional wives, an25,000observations of nontraditional husbands. Reported observation countsare rounded according to the Census Bureaudisclosure avoidance requirements. ��14 &#x/MCI; 0 ;&#x/MCI; 0 ;Figure Mean characteristics of traditional and nontraditional couplesSource: Current Population Survey Annual Social and Economic Supplement (CPSASEC) from survey years 2003 to 2013 linked to Social Security Detailed Earning Record (DER) from tax years 2002 to 2012.Notes: Marital earnings are nontraditional if the wife’s DER earnings exceed the husband’s DER earnings and traditional otherwise. The estimation sampleis the analysis sample described in section It containapproximately 101000observations of traditional couples and 30000observations of nontraditional couples. Reported observation countsare rounded according to the Census Bureau’s disclosure avoidance requirements. The error bars represent 95percent confidence intervals based on standard errors clustered by couple. ��15 &#x/MCI; 0 ;&#x/MCI; 0 ;Figure OLS regression results: ffectof being male reporting gapbetween survey and administrative earningsby marital earningsclassificationof survey subjectSource: Current Population Survey Annual Social and Economic Supplement (CPSASEC) from survey years 2003 to 2013 linked to Social Security Detailed Earning Record (DER) from tax years 2002 to 2012.Notes: Reporting gap = (CPSASEC earnings DER earningsDER earningsMarital earningsarenontraditional if the wife’s DER earnings exceed the husband’s DER earnings and traditional otherwiseThe estimating equation is equation . The estimation sample isobservations of employed husbands and wives from the analysis sample described in section . It contains approximately 71500observations of traditional wives, 101000observations of traditional husbands,30000observations of nontraditional wives, and 25000observations of nontraditional husbands.Reported observation countsarerounded according tothe Census Bureau’s disclosure avoidance requirementsThe figure presents the average marginal effect of being male when all survey subjects are treated as traditional and when all are treated as nontraditional. Theestimatescontrol for the survey subject’sown and
17 his or herspouse’s age, race, educ
his or herspouse’s age, race, education, and DER earnings;thecouple’s region of residence, metropolitan status, and total DER earnings; the wife’s share of thecouple’s total DER earnings; and whether the surveyrespondentfor the couplewas the husband, the wife, orsomeone elsehe error bars represent 95percent confidence intervals based on standard errors clustered by couple. ��16 &#x/MCI; 0 ;&#x/MCI; 0 ;Figure OLS regression results: Effect of having nontraditional marital earnings on reportinggapbetween survey and administrative earnings, by sex of survey subjectSource: Current Population Survey Annual Social and Economic Supplement (CPSASEC) fromsurvey years 2003 to 2013 linked to Social Security Detailed Earning Record (DER) from tax years 2002 to 2012.Notes: Reporting gap = (CPSASEC earnings DER earnings)/DER earningsMarital earnings are nontraditional if the wife’s DER earnings exceed the husband’s DER earnings and traditional otherwise. The estimating equation is equation . The estimation sample is observations of employed husbands and wives from the analysis sample described in section . It contains approximately 71500observations of traditional wives, 101000observations of traditional husbands, 30000observations of nontraditional wives, and 25000observations of nontraditional husbands.Reported observation countsare rounded according to the Census Bureau’s disclosure avoidance requirements.The figure presents the average marginal effect of being nontraditional when all survey subjects are treated as male and when all are treated as female. The estimates control for the survey subject’s own and his or her spouse’s age, race, education, and DER earnings; the couple’s region of residence, metropolitan status, and total DER earnings; the wife’s share of the couple’s total DER earnings; and whether the survey respondent for the couple was the husband, the wife, or someone else.The error bars represent 95percent confidence intervals based on standard errors clustered by couple. ��17 &#x/MCI; 0 ;&#x/MCI; 0 ;Figure Fixed effects regression results: Effect of having nontraditional marital earnings on reporting gap between surveyand administrative earnings, by sex of survey subjectSource: Current Population Survey Annual Social and Economic Supplement (CPSASEC) from survey years 2003 to 2013 linked to Social Security Detailed Earning Record (DER) from tax years 2002 to 2012.Notes: Reporting gap = (CPSASEC earnings DER earnings)/DER earningsMarital earnings are nontraditional if the wife’s DER earnings exceed the husband’s DER earnings and traditional otherwise. The estimation sampleisobservations of “swit
18 chers” from the analysis sample des
chers” from the analysis sample described in section individuals in the analysis sample for whom we observe one reporting gap in a year when they have traditional marital earnings and onein a year when they have nontraditional marital earnings. This samplecontains approximately 100observations of husbands and 100observations of wives. Reported observation countsare rounded according tothe Census Bureau’s disclosureavoidance requirements. The figure presents marginal effects from equation , estimated separately for husbands and wives. The estimates control for the survey subject’s own and his or her spouse’s age, education, and DER earnings; the couple’s total DER earnings; the wife’s share of the couple’s total DER earnings; whether the survey respondent for the couple was the husband, the wife, or someone else; and person xed effects that capture timeinvariant characteristics of the person, his or her spouse, and their marriage. The error bars represent 95percent confidence intervals based on standard errors clustered by couple. ��18 &#x/MCI; 0 ;&#x/MCI; 0 ;Figure OLS regression results: Effect of having nontraditional marital earnings on reporting gap between survey and administrative earnings, by sex of survey subject and respondentSource: Current Population Survey Annual Social and Economic Supplement (CPSASEC) from survey years 2003 to 2013 linked to Social Security Detailed Earning Record (DER) from tax years 2002 to 2012.Notes: Reporting gap = (CPSASEC earnings DER earnings)/DER earningsMarital earnings are nontraditional if the wife’s DER earnings exceed the husband’s DER earnings and traditional otherwise. The estimation sample is observations of employed husbands and wives from the analysis sample described in section , excluding those whose survey responses were provided by someone other than the husband or the wife. It contains approximately 56500observations of wives reporting for wives, 42500observations of husbandsreporting for wives72000observations of wivesreporting for husbands, and 51000observations of husbands reporting for husbands. Reported observation countsare rounded in accordance with the Census Bureau’s disclosure avoidance requirements.The figure presents marginal effects from equation, estimated separately for each combination of subject and respondent sex. The estimates control for the survey subject’s own and his or her spouse’s age, race, education, and DER earnings; the couple’s region of residence, metropolitan status, and total DER earnings;andthe wife’s share of the couple’s total DER earnings. The error bars represent 95percent confidence intervals based on standard errors clustered by c