

Impact Estimation Methodology Dan Hansen Christensen Associates Energy Consulting DRMEC Spring Workshop May 10 2016 May 2016 1 May 2016 2 Presentation Outline What is a matched control group ID: 1030226
Download Presentation The PPT/PDF document "Overview of the Matched Control Group Lo..." is the property of its rightful owner. Permission is granted to download and print the materials on this web site for personal, non-commercial use only, and to display it on your personal computer provided you do not modify the materials and that you retain all copyright notices contained in the materials. By downloading content from our website, you accept the terms of this agreement.


1. Overview of the Matched Control Group Load Impact Estimation MethodologyDan HansenChristensen Associates Energy ConsultingDRMEC Spring WorkshopMay 10, 2016May 20161
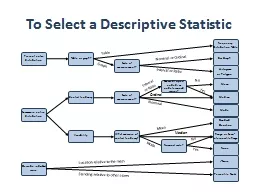
2. May 20162Presentation OutlineWhat is a matched control group?Why would you use it?How do you do it?What do you do after the matching is done?Are there any potential problems with the method?Summary
3. May 201631. What is a matched control group?It is a group of customers that is as similar as possible to the treatment customers being studied, but who are not subjected to the treatment (e.g., PG&E’s Residential SmartRate program)The control group is not developed from an experimental design (e.g., a random draw of eligible customers where some are assigned the treatment and others are assigned to the control group)Rather, it is based on a matching process using observable characteristics (e.g., load data, location, industry, CARE status), where the most similar eligible control customer is matched to each treatment customer
4. May 201642. Why would you use a matched control group?Matched control groups are useful when:An experimentally designed control group is unavailable (which is typically the case for non-pilot programs)There is a sizeable pool of eligible control customers (there are a lot of residential customers, but relatively few air products industrial customers)The treatment is not event-based (e.g., TOU pricing)The treatment is event based, but you are interested in potential non-event day treatment effectsThe treatment is event-based, but most or all of the hottest days are called as events
5. May 201653. How do you make a matched control group?There are two commonly used methods for developing a matched control group:Propensity score matching (PSM)Euclidean distance matchingPropensity score matching:Discrete choice regression model with one observation for each treatment and eligible control customer (regression can be segmented by characteristics)Dependent variable = 1 if treatment, 0 if eligible controlExplanatory variables include observable characteristics (e.g., peak/off-peak usage ratio, other usage-based variables, LCA indicators, CARE status, industry group indicators)Model predicts each customer’s propensity score, which is the probability that the customer is a treatment customer given the characteristics included in the modelEach treatment customer is matched to the eligible control customer with the closest propensity score (“nearest neighbor”)
6. May 201663. How do you make a matched control group? (2)Euclidean distance matching:Calculate the “distance” between the characteristics of each treatment customer and every eligible control customerSelect the eligible control customer with the shortest distanceHow is distance measured?where the T variables represent treatment customer characteristics and the C variables represent the corresponding eligible control customer characteristicsIt can be important to “segment” the matchesE.g., only match CARE customers other CARE customersHow have you implemented it in load impact studies?First segment customers according to characteristicsWithin segment, calculate distance using load shape data (e.g., 24-hour profiles for the average and hot non-event days)
7. May 201674. What do you do with the matched control group?Once you have a matched control group, load impacts can be estimated using a difference-in-differences approachUnder this method, you compare treatment and control group usage on event days (or when customer faces TOU rates) and adjust that difference for the difference between the groups on non-event days (or before the customer faced TOU rates)The simple calculation is:Load impact = (kWhT,1 – kWhC,1) – (kWhT,0 – kWhC,0)In this equation, T = treatment customer and C = control customer; 1 = treatment period and 0 = non- or pre-treatment periodCan also estimate regressions that may or may not include other explanatory variables (e.g., weather)
8. May 201684. Illustrating Difference-in-Differences EstimatesMatch isn’t very good: C is 10% higher than T.
9. May 201694. Illustrating Difference-in-Differences Estimates (2)Incorrectly includes 5% exogenous increase from pre to post
10. May 2016105. Any potential problems with matched control groups?Just because your match looks good doesn’t guarantee it will produce a good load impact estimateFor example, suppose:Pre-treatment loads used to match are from a mild weather year, the treatment period has hot weather, and the match doesn’t account for thermostat set points or the willingness to endure days without turning on AC;AND suppose the treatment group happens to contain a higher share of customers with a high thermostat set point or a high willingness to endure days without turning on AC (due to self selection into the program);THEN the load impact estimate will be biased upward (i.e., even with no program-related load response, treatment loads will be less than control loads in the treatment period – and even DinD won’t fix it)In practice, this problem seems unlikely to occurUnobservable characteristics have to affect the change in loads (i.e., from pre-treatment to post-treatment or from non-events to events) differently for treatment and control groupsUnobservable effects on load that are constant across time are differenced out (by D-in-D method) and therefore do no affect load impact estimates
11. May 2016116. SummaryMatched control groups are a way of mimicking an experimental design when one is not availableIts effectiveness depends on the availability of a “good” pool of eligible control customers (large enough sample, adequate range of observed characteristics, sufficiently similar to treatment customers except for treatment)It is important to consider the potential effect of unobservable characteristics on the resulting estimatesDifference-in-differences method can compensate for many but not all biases that could arise due to a failure to include unobserved characteristics
12. May 201612Questions? Contact – Dan Hansen, Christensen Associates Energy ConsultingMadison, Wisconsindghansen@CAEnergy.com608-231-2266