
Lie and Why Multi Increment Sampling is Important A Field Study of Heterogeneity Roger Brewer rogerbrewerdohHawaiigov John Peard Hawaii Dept of Health Marvin Heskett Element Environmental ID: 1037661
Download Presentation The PPT/PDF document "Why Discrete Soil Samples" is the property of its rightful owner. Permission is granted to download and print the materials on this web site for personal, non-commercial use only, and to display it on your personal computer provided you do not modify the materials and that you retain all copyright notices contained in the materials. By downloading content from our website, you accept the terms of this agreement.


1. Why Discrete Soil Samples Lieand Why Multi Increment Sampling is Important:A Field Study of HeterogeneityRoger Brewer (roger.brewer@doh.Hawaii.gov), John Peard; Hawaii Dept of HealthMarvin Heskett, Element EnvironmentalBattelle Conference, Palm Springs May 20161
2. 2Let me tell you why you’re here. You’re here because you know something. What you know you can’t explain. But you felt it. You felt it your entire life. That there’s something wrong with the world. You don’t know what it is, but it’s there. Like a splinter in your mind – driving you mad.Morpheus (The Matrix )Decision Unit & Multi Increment SamplingSite Characterization Methods
3. The Origin of Discrete Soil Sampling- Never Tested in the Field -“When there is little distance between points it is expected that there will be little variability between points.”USEPA 1989: Methods for Evaluating the Attainment of Cleanup Standards“The implicit assumption (that…) contamination is… likely to be (uniformly) present anywhere within the sampling area is reasonable.”USEPA 1985: Verification of PCB Spill Cleanup 3
4. “How’s that working for you?”Failed confirmation samples and multiple over excavationsAccidental Import or Export of Contaminated SoilNeed for multiple remobilizations and “step-out” investigations
5. Every wonder... ?X???“What if I moved my sample point over a few feet?“What if the lab tested a different aliquot of soil?”Metals:0.5-1.0 gramsVOCs:5 gramsPCBs, Pesticides, etc.10-30 gramsDiscrete soil samples rarely processed properly;Attempts to “homogenize” samples misleadingData only reliably represent the mass actually tested.
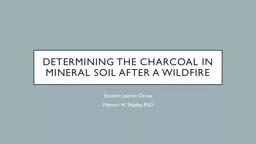
6. So did we… Discrete Soil Sample Variability Field StudyStudy Site A(arsenic in wastewater)Study Site B(lead in incinerator ash)Study Site C(PCBs transformer oil)1,500 ft2 area13,500 ft2 area6,000 ft2 areaThree sites with known contamination targeted;24 grid points designated at each sites;Hundreds of discrete samples collected;Existing data suggested lower heterogeneity at arsenic site and higher heterogeneity at PCB site, with lead site in between.
7. 1. Small-Scale Variability of Discrete Soil Sample Data (June 2015): Part 1: Field Investigation of Discrete Sample Variability Part 2: Causes and Implications for Use in Environmental InvestigationsHawai′i Department of Health, Hazard Evaluation and Emergency Response: http://eha-web.doh.hawaii.gov/eha-cma/Org/HEER/(“What’s New” July 2015)References – Discrete Sample Reliability7Brewer, R., Peard, J. and M. Heskett, 2016, A critical review of discrete soil sampling methods (manuscript submitted May 2016)
8. MetalsPCBsMetals: Portable XRF analysis in lab;PCBs: Discrete sample split into ten subsamples for individual analysis.Intra-Sample Variability Are laboratory data representative of the sample submitted?Single discrete sample tested ten times
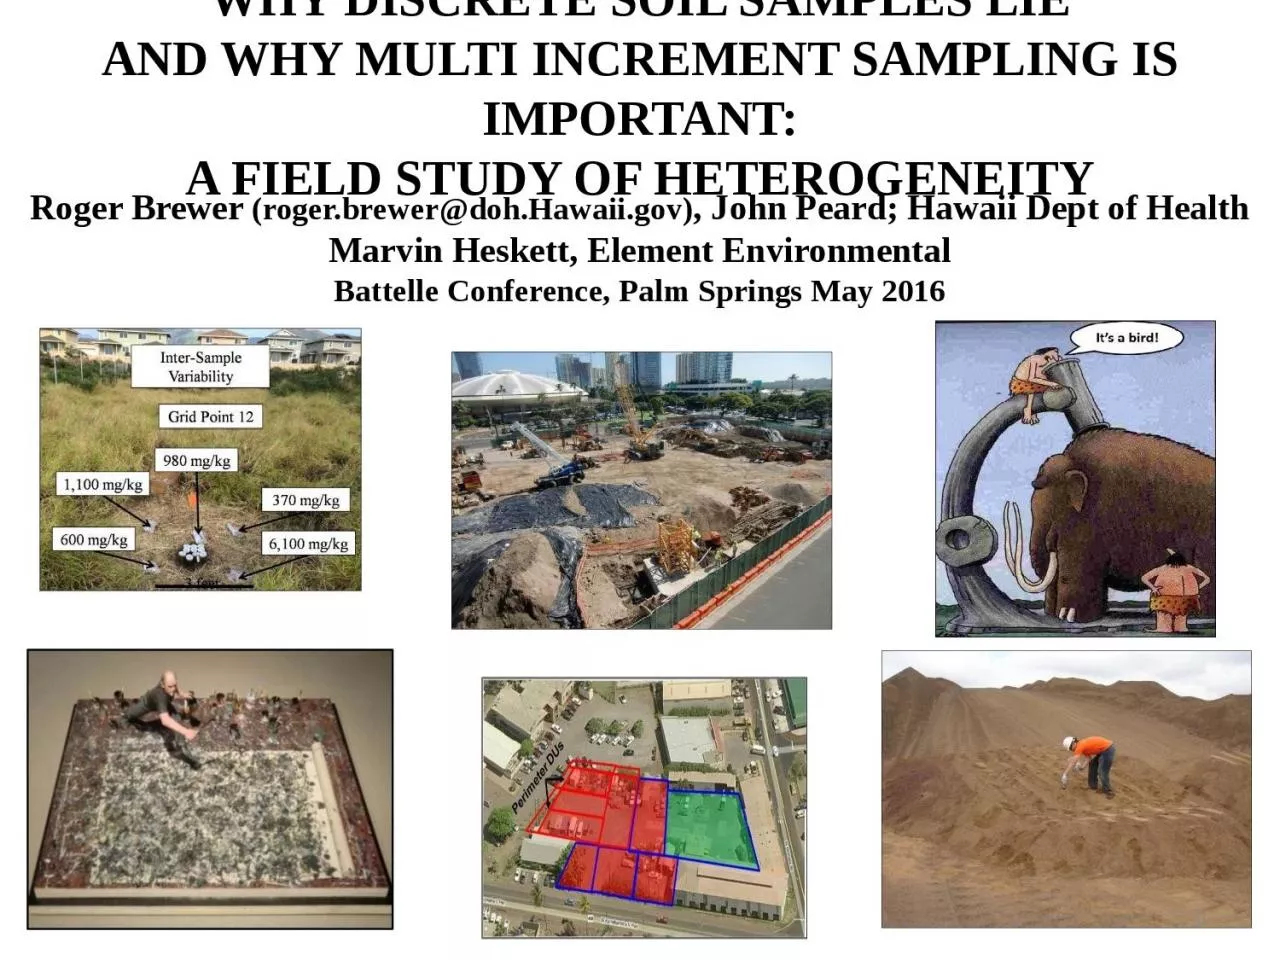
9. 3 feetSamples “IS” processed for testing (dried, sieved and subsampled);Metals: Method 6810B (extraction)Data assumed representative of sample.Five “co-located” discrete samples testedInter-Sample Variability Is the sample representative of area where it was collected?
10. 172 mg/kg196mg/kg199 mg/kg204 mg/kg141 mg/kg161 mg/kg165 mg/kg165 mg/kg169 mg/kg172 mg/kg“Low” Variability at Arsenic Study Site(arsenic-contaminated wastewater, fine-grained soils)Average Max:Min = 1.5XMaximum Max:Min = 2.5XGrid Pt #2Variability within a single sampleIntra-Sample Variability
11. 140mg/kg120 mg/kg230mg/kg260mg/kg120mg/kgGrid Pt #2“Low” Variability at Arsenic Study Site(arsenic-contaminated wastewater, fine-grained soils)Inter-Sample VariabilityAverage Max:Min = 1.4XMaximum Max:Min = 2.2XVariability between co-located samples
12. Average Max:Min = 4XMaximum Max:Min = 15XHawai’i Lead EAL = 200 mg/kgGrid Pt #7Variability within a single sample“Moderate” Variability at Lead Study Site(lead-contaminated ash mixed with soil)Intra-Sample Variability295 mg/kg311 mg/kg327 mg/kg337 mg/kg166 mg/kg191 mg/kg214 mg/kg216 mg/kg222mg/kg270 mg/kg
13. 3 feetGrid Pt #7Average Max:Min = 2XMaximum Max:Min = 7X“Moderate” Variability at Lead Study Site(lead-contaminated ash mixed with soil)Hawai’i Lead EAL = 200 mg/kgInter-Sample Variability240 mg/kg800 mg/kg240mg/kg260mg/kg120 mg/kgVariability between samples is random and not indicative of larger-scale trends
14. Lead above and below HDOH 200 mg/kg screening level in discrete samples around 18+ of 24 grid points;Entire area might “pass” (green) or “fail” (red), with myriad of potential, map patterns in between;Map patterns based on any given data set are random and artificial.Note seemingly isolated “hot spots” and “cold spots” in lower maps.Artificial Map Patterns(Study Site B random selection of grid point data)
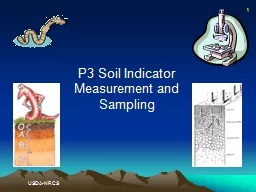
15. Which Pattern is “Real”? (Hint: None…)(results of area-wide DU-MIS investigation)15AMEC HIStudy Area BAttempts to investigate site using discrete sampling methods would be highly inefficient and misleading;Estimation of mean for well-thought-out DUs is the objective;Estimation of lead concentration at any given, discrete sample point is not meaningful or even feasible.10 acres
16. “High” Variability at PCB Study Site(waste electric oil dumped on bare soil)2,700 mg/kg3,100 mg/kg3,200 mg/kg5,700 mg/kg810 mg/kg910 mg/kg1,000 mg/kg1,400 mg/kg2,600 mg/kg 2,700 mg/kgGrid Pt #24Average Max:Min = 17XMaximum Max:Min = 116XAverage = 2,400 mg/kg!Intra-Sample Variability
17. “High” Variability at PCB Study Site(waste electric oil dumped on bare soil)4.9 mg/kg7.7 mg/kg6.0 mg/kg91 mg/kg14 mg/kg3 feetAverage Max:Min = 11XMaximum Max:Min = 490X2,400! mg/kgGrid Pt #24Inter-Sample Variability
18. Suspect PCB-Infused Tar Balls (Nuggets)Suspect PCB-Infused Nuggets:Scattered but visible throughout soil sample;Rounded shape <1mm to 2mm in size;Soft, crumbles when pressed;Thin, outer rim with coating of fine particles;Darker particle mixture inside.SuspectPCB-RichNugget in SoilEasilyBrokenPhotomicrograph (*different nugget)2mm1mm1cm
19. How to Make PCB Nuggets in Soil1cm1cmThinOuter RimFresh Olive Oil DropletDroplet Remnant After Sinking Into FlourOlive Oil-Infused Nuggets in FlourOlive Oil Droplets Formed on Dry Flour19
20. 20Summary of *Estimated Median, Total Discrete Sample Variability for Study Site Grid PointsWater Dispersed Pesticide(2.0X)Mixed Incinerator Ash and Fill(7.5X)Variability at some grid points significantly higher (max >1,000X);*Based on limited sample data for total volume of 0-4” soil around grid points (<1k of total 100+kg tested);Actual total variability would be higher if more samples tested.PCB-Infused Nuggets(39X)
21. The Bottom Line:Discrete Samples are too small to Overcome and Capture Random, Small-Scale Variability of ContaminantsResult:Lab data not reliably representative of discrete sample submitted;Discrete sample not reliably representative of immediate area where it was collected.
22. 21st Century EnlightenmentWhat we thought in the 1980s:What we know in the 2010s:Contaminated Soil is likea Bowl of CheeriosContaminant concentrations can vary significantly and randomly between discrete-size masses of soil;Collection and combination of a large number of “increments” is required to obtain a representative sample.Contaminated Soil is likea Bowl of Froot LoopsContaminant concentrations identical regardless of sample location and mass of soil tested sample;Testing of any given, small mass will be representative of area as a whole.
23. 23Think About the Implications…You take the red pill – you stay in Wonderland and (find out) how deep the rabbit hole goes.Morpheus (starting Neo on his journey in The Matrix )Five Stages of Grief:Denial, Anger, Bargaining, Depression and Acceptance
24. Why DUs (and ISM) are Important(Discrete Sample Data)>Action Level<Action Level100’PCB sample aliquot = 30 grams (one spoonful of soil)Discrete data: Estimated 10,000 ft2 soil?After ITRC (2014)Former Power Plant (PCBs)Discrete SamplePremature termination of investigation“False Negatives”Unavoidable1.5 Acres
25. Why DUs (and ISM) are Important(ISM Sample Data)> Action Levels< Action LevelsMIS Data: Estimated 25,000+ ft2 soil(perimeter DUs pending)Perimeter DUsAfter ITRC (2014)100’Investigation Continuing (2016)Discrete data significantly underestimated extent of contaminationFormer Power Plant (PCBs)
26. Real and Artificial Map Patterns(discrete data for PCBs)Note seemingly isolated “hot spots” and “cold spots;”Classic signal of random, small scale heterogeneity;Large-scale patterns probably real;Smaller-scale patterns likely artificial and not reproducible;Resampling would show similar spots but in different locations.26
27. More Realistic Data ResolutionUse to assist in designation of DUs and collection of MI samples;”Could also be used for initial removal actions;Collect DU-MIS data for confirmation.More Realistic Resolution of PCB Data27
28. 500kmNArsenic in US Surface Soil (USGS 2014)Based on approximately 4,000, 1m2 ground samplesReal “Hot Areas” and Artificial “Hot Spots”28
29. 25kmArtificial 2,400 km2 Arsenic “Hot Spot” in NCBased on single, 1m2 discrete soil sample,Heterogeneous, metamorphic geologic terrane;Sample likely collected from random, narrow mineralized zone;Significant over interpretation of discrete sample data.Discrete sample location29
30. 500kmNBased on approximately 4,000, 1m2 ground samplesFor Example Only (RB 6 13 14)Soil data “filtered” to remove noise likely associated with random, small-scale heterogeneityMore Realistic Resolution of USGS Arsenic Data30
31. Statistics Can’t Fix Non-Representative Data(estimation of means from single data set)Study Site B (Lead): Calculated 95% UCL based on different combinations of grid point dataStatistical tests only evaluate the precision of the test method used to estimate a mean for the data set provided;Field representativeness of single discrete sample data set unknown;RSD can provide some clues (e.g., high = lower certainty) but sample collection method is most important part of quality control.Parameter*Lead (mg/kg)LowestData PtsMedian Data PtsHighest Data PtsMean:131 mg/kg262 mg/kg452 mg/kgRSD:58%53%64%95% UCL:157 mg/kg325 mg/kg559 mg/kg*Based on evaluation of intra-sample data for each grid point; 95% UCLs calculated using ProUCL (Student t, Gamma and H 95% UCL selected, respectively).
32. Study Site B(lead in incinerator ash)Triplicate MI Sample DataSample A:240 mg/kgSample B:270 mg/kgSample C:350 mg/kgRSD:20%Mean:287 mg/kg*95% UCL:346 mg/kg*Student's t 60-increment MI samples collected (1-2kg);Reasonably good precision (<35%);Direct comparison of unadjusted DU data or replicate data mean to target action level acceptable;Average lead concentration above HDOH action level (but below current USEPA RSL).Study Site B (lead): Multi Increment Sample Data
33. Statisticians often get stuck with un-interpretable discrete sample data;Exclusion of “outliers” from data set distorts estimation of mean in a risk assessment;It’s the sampling method, not the statistical method;You would get fired if you deleted (or over interpreted) data for “discrete” gold veins in an ore body.Other Risk Assessment ProblemsDon’t Throw Out the Outliers!Outliers Are Golden33All data not known to be in error should be considered valid… High concentrations are of particular concern for their potential health and environmental impact.USEPA 1989. Methods for Evaluating the Attainment of Cleanup Standards
34. Concentration #1(whole sample)2mm1mm1cmAcute Hangups and the Myth of “Maximum”Contaminant ConcentrationsConcentration #2(single nugget)Concentration #3(PCB matrix)Low ppm1,000s ppm100,000s ppmAll soil sample data represent a mean;Concentration varies with mass of soil tested;Maximum concentration always 0 % (absent) or 100% (present);Key: “What is the mass of soil of interest?” (i.e., the “Decision Unit”);Clearance of site for “acute toxicity” hot spot DUs is not possible (billions of 10g DUs for pica child, no acute toxicity RSLs).
35. Discrete sampling methods can identify the core of heavy contamination (e.g., any small mass of soil exceeds screening level);“False negatives” and premature termination of initial investigation unavoidable in outer areas (small masses both above and below screening level);Confusion over artificial “hot spots” common;Representativeness of discrete sample data set for use in risk assessment not directly testable;Deletion of “outliers” in risk assessments distorts estimation of the true mean;Use of discrete sampling methods highly inefficient at best and highly misleading at worst.Summary35
36. Solution: Decision Units & Multi Increment Sample (aka “Incremental Sampling”) Investigation Methods36Sometimes the questions are complicated and the answers are easy. Dr SeussSteps to Representative Samples:1. Designate well-thought-out Decision Units for characterization;Collect a big sample from multiple points across the DU (i.e., a “Multi Increment” sample);Properly process the sample for analysis to retain field representativeness Significantly improves data reliability and expedites completion of projects.
37. References and Training CoursesITRC: Incremental Sampling Methodologyhttp://itrcweb.org/ism-1/Introduction to incremental sampling Envirostat, Inc.: Chuck Ramsey (www.envirostat.org)Four-day, detailed introduction to sampling theory and Multi-Increment Sample site investigations; Francis Pitard Sampling Consultants, LLC: Francis Pitard (www.fpscsampling.com)Advanced statistical sampling concepts with a focus on optimization of sampling protocols and mining exploration.37
38. Technical Guidance Manual (updates to be posted in Summer 2016)Sect 3: Sampling Theory and Systematic Planning (DUs, etc.)Sect 4: DU Characterization (Multi Increment Sampling)Sect 5: Field Implementation (DU and increment marking, sample collection tools, etc.)Hawai′i Department of Health, Hazard Evaluation and Emergency Response: http://eha-web.doh.hawaii.gov/eha-cma/Org/HEER/DU-MIS Field Implementation (Hawaii DOH)38
39. 39Questions?Wrong Question: “When are DU-IS methods applicable?”Right Question: “Knowing what we now know, when are discrete sampling methods still acceptable?”NOT Just Another Tool in the Tool Box…Discrete SamplingMulti Increment SamplingIt’s an entirely NEW and IMPROVED set of tools.