
Media Inquiries Social Economic Housing Statistics Division Financial Market Characteristics Branch Public Information Office 301 763 3199 Robert Callis Patricia Holley Daniel Tr ID: 845309
Download Pdf The PPT/PDF document "Data Inquiries" is the property of its rightful owner. Permission is granted to download and print the materials on this web site for personal, non-commercial use only, and to display it on your personal computer provided you do not modify the materials and that you retain all copyright notices contained in the materials. By downloading content from our website, you accept the terms of this agreement.


1 Data Inquiries Media Inquiries Socia
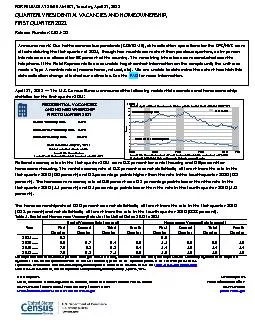
Data Inquiries Media Inquiries Social, Economic & Housing Statistics Division, Financial & Market Characteristics Branch Public Information Office 301 - 763 - 3199 / Robert Callis / Patricia Holley / Daniel Truver 301 - 763 - 3030 sehsd.financial.market.characteristics@census.gov pio@census.gov FOR RELEASE AT 10:00 AM ES T, T uesday , April 27 , 202 1 QUARTERLY RESIDENTIAL VACANCIES AND HOMEOWNERSHIP, FIRST QUARTER 2021 Releas e Number: CB 21 - 56 April 27 , 2021 — The U.S. Census Bureau announced the following residential vacancies and homeownership statistics for the first quarter 2021 : National vacancy rates in the first quarter 2021 were 6. 8 percent for rental housing and 0.9 percent for homeowner housing. The rental vacancy rate of 6. 8 percent was not statistically different from the rate in the first quarter 2020 (6. 6 percent) and 0.3 percentage points higher than the rate in the fourth quarter 2020 ( 6. 5 percent). T he homeowner vacancy rate of 0.9 percent was 0. 2 percentage points lower than the rate in the first quarter 2020 (1. 1 per cent) and 0.1 percentage points lower than the rate in the fourth quarter 2020 ( 1.0 percent) . The homeownership rate of 65. 6 percent was not statistically different from the rate in the first quarter 2020 (6 5. 3 percent) and not statistically different from the rate in the fourth quarter 2020 ( 65.8 percent). Table 1. Rental and Homeowner Vacancy R ates for the United States: 201 8 to 2021 Rental Vacancy Rate (percent) Homeowner Vacancy Rate (percent) Year First Quarter Second Quarter Third Quarter Fourth Quarter First Quarter Second Quarter Third Quarter Fourth Quarter 2021…… 6.8 0.9 2020…… 6.6 5.7 6.4 6.5 1.1 0.9 0.9 1.0 2019…… 2018…… 7.0 7.0 6.8 6.8 6.8 7.1 6.4 6.6 1.4 1.5 1.3 1.5 1.4 1.6 1.4 1.5 All comparative statements in this report have undergone statistical testing, and unless otherwise noted, all comparisons are statistically significant at the 90 percent significance level. For an explanation of how the rates are calculated, please see the Explanatory Notes at the end of the press release. Explanations of confidence intervals and sampling variability can be found on the CPS/HVS website at : www.census.gov/housing/hvs � Source: U.S. Census Bureau, Current Population Survey/Housing Vacancy Survey , April 2 7 , 2021 . 0 1 2 3 4 5 6 7 8 9 10 11 12 1998 2003 2008 2013 2018 2021 Percent Quarterly Rental and Homeowner Vacancy Rates for the United States: 1998 - 2021 Rental Vacancy Rate Homeowner Vacancy Rate Recession Figure 1 Source: U.S. Census Bureau, Current Population Survey/Housing Vacancy Survey, April 27, 2021 Recession data: National Bureau of Economic Research, ww.nber.org&#xw880; RESIDENTIAL VACANCIES AND HOMEOWNERSHIP FIRST QUARTER 2021 Rental Vacancy Rate 6. 8 % Homeowner Vacancy Rate 0.9 % Homeownership Rate 65.6 % Next release: July 27, 2021 Data are not adjusted for seasonality. Source: U.S. Census Bureau, Current Population Survey/Housing V acancy Survey, April 27, 2021 Announcement: Due to the coronavirus pandemic (COVID - 19), data collection operations for the CPS/HVS were affected during the first quarter of 2021, though to a much lesser extent than previous quarters, as in - person interviews were allowed for 98 percent of the country . The remaining interviews were conducted over the telephone. If the Field Representative was unable to get contact information on the sample unit, the unit
2 was made a Type A noninterview (no one
was made a Type A noninterview (no one home, refusal, etc). We are unable to determine the extent t o which this data collection change affected our estimates. See the FAQ for more information. Data Inquiries Media Inquiries Social, Economic & Housing Statistics Division, Financial & Market Characteristics Branch Public Information Office 301 - 763 - 3199 / Robert Callis / Patricia Holley / Daniel Truver 301 - 763 - 3030 sehsd.financial.market.characteristics@census.gov pio@census.gov In the first quarter 2021 , the median asking rent for vacant for rent units was $ 1,226 . In the first quarter 2021 , the median asking sales price for vacant for sale units was $ 2 00 , 9 00 . 1. Median asking rent and median asking sales price data for vacant units can be found in Historical Table 11A/B at www.census.gov/housing/hvs/data/histtabs � 2 . The data in figures 2 and 3 are not adjusted for price changes. 400 500 600 700 800 900 1000 1100 1200 1300 1997 2001 2005 2009 2013 2017 2021 Recession Dollars ($) Median Asking Rent for Vacant for Rent Units: 1997 - 2021 Figure 2 50,000 75,000 100,000 125,000 150,000 175,000 200,000 225,000 250,000 1997 2001 2005 2009 2013 2017 2021 Recession Dollars ($) Source: U.S. Census Bureau, Current Population Survey/Housing Vacancy Survey April 27, 2021 Recession data: National Bureau of Economic Research, www.nber.org � Median Asking Sales Price for Vacant for Sale Units: 1997 - 20 21 Figure 3 (Current Dollars) (Current Dollars) Source: U.S. Census Bureau, Current Population Survey/Housing Vacancy Survey, April 27 , 2021 Recession data: National Bureau of Economic Research, www.nber.org � Data Inquiries Media Inquiries Social, Economic & Housing Statistics Division, Financial & Market Characteristics Branch Public Information Office 301 - 763 - 3199 / Robert Callis / Patricia Holley / Daniel Truver 301 - 763 - 3030 sehsd.financial.market.characteristics@census.gov pio@census.gov The rental vacancy rate in principal cities ( 7.3 percent) was higher than the rate in the suburbs (5.8 percent). The rate outside MSAs (7.7 percent) was higher than both the rate s inside MSAs (6.7 percent) and in the suburbs. The rate in principal cities was not statistically different from the rate outside MSAs. The rate in principal cities was higher than the first quarter 2020 rate, the rate outside MSAs was lower than the first quarter 2020 rate, but the rate in the suburbs was not statistically different from the first quarter 2020 rate . The homeowner vacancy rate in principal cities (1.0 percent) was higher than the rate in the suburbs (0.8 percent) but virtually the same as the rate outside MSAs (1.0 percent). The rate outside MSAs was not statistically different from both the rates inside MSA and in the suburb s. The rates in all areas were lower than the first quarter 2020 rates. The rental vacancy rate was lowest in the West (4. 9 percent). The rate in the Midwest (7.9 percent) was higher than the rate in the Northeast (6.8 percent), while the rate in the South (7.5 percent) was not statistically different from the rates in the Northeast and Midwest. The rates in the Northeast and West were higher than their first quarter 2020 rates. The rate in the South was lower than the first quarter 2020 rate. The rate in the Midwest was not statistically different from the first quarter 2020 rate. The homeowner vacancy rate was highest in the South (1.1 percent). The rate in the West (0.8 percent) was virtually the same as the rate in the Midwest (0.8 percent). T he rate in the West
3 was higher than the rate in the Northea
was higher than the rate in the Northeast (0.6 percent), but the rate in the Midwest was not statistically different from the rate in the Northeast. The rates in the Northeast and South were lower than the first quarter 2020 rates, while the rates in the Midwest and West were not statically different from the first quarter 2020. Table 2. Rental and Homeowner Vacancy Rates by Area and Region: First Quarter 20 20 and 2021 Rental Vacancy Rates (percent) Homeowner Vacancy Rates (percent) Area/Region First Quarter 2020 * First Quarter 2021 Margins of Error a First Quarter 2020 First Quarter 2021 Margins of Error a of 2021 rate of difference of 2021 rate of difference United States.....…..….. Inside Metropolitan Statistical Areas....….... ... In principal cities … .… ... Not in principal ... cities (suburbs) … …... Outside Metropolitan Statistical Areas … ……. Northeast.........……..... Midwest...........…...….. South...............……… … West................……… … 6.6 6. 3 6.4 6.2 9.1 5.5 7.1 8.6 4.1 6.8 6.7 7.3 5.8 7.7 6.8 7.9 7.5 4.9 0.2 0.3 0.4 0.4 0. 9 0. 6 0. 8 0. 4 0.4 0.3 0. 3 0.5 0.5 1.0 0.8 1.0 0.6 0.6 1.1 1.1 1.3 1.0 1.3 1.0 0.9 1.4 1.0 0.9 0.9 1. 0 0. 8 1 . 0 0.6 0.8 1. 1 0. 8 0.1 0. 1 0. 2 0.1 0.2 0. 1 0. 1 0.1 0.1 0.1 0.1 0.2 0.1 0.2 0. 2 0.2 0.2 0.2 a A margin of error is a measure of an estimate’s reliability. The larger the margin of error in relation to the size of the es timate, the less reliable the estimate. This number, when added to and subtracted from the estimate, forms the 90 percent confidence interval. * Due to a weighting error corrected after publication, first quarter 2020 estimates may differ by 0.1 percentage points from t he originally published numbers. Source: U.S. Census Bureau, Current Popula tion Survey/Housing Vacancy Survey, April 2 7 , 2021 . Data Inquiries Media Inquiries Social, Economic & Housing Statistics Division, Financial & Market Characteristics Branch Public Information Office 301 - 763 - 3199 / Robert Callis / Patricia Holley / Daniel Truver 301 - 763 - 3030 sehsd.financial.market.characteristics@census.gov pio@census.gov Approximately 89. 0 percent of the housing units in the United States in the first quarter 2021 were occupied and 11.0 percent were vacant. Owner - occupied housing units made up 58 . 3 percent of total housing units, while renter - occupied units made up 30. 6 percent of the inventory in the first quarter 2021 . Vacant year - round units comprised 8.4 percent of total housing units, while 2. 7 percent were vacant for seasonal use. Approximatel y 2. 2 percent of the total units were vacant for rent, 0. 5 percent were vacant for sale only and 0. 7 percent were rented or sold but not yet occupied. Vacant units that were held off market comprised 4. 9 percent of the total housing stock – 1. 4 percent wer e for occasional use, 0. 9 percent were temporarily occupied by persons with usual residence elsewhere (URE) and 2. 7 percent were vacant for a variety of other reasons. Table 3. Estimates of the Total Housing Inventory for the United States: First Quarter 2020 and 202 1 a (Estimates are in thousands, estimates may not add to total due to rounding)
4 Type First Quarter 2020 (r)")
Type First Quarter 2020 (r) First Quarter 2021 Difference Between Estimates Margins of Error b Percent of total ( 2021 ) of 2021 estimate of difference All housing units................ .. Occupied.......................... …. Owner............................ …. Renter............................ .. Vacant.............................. …. Year - round.................... . …... For rent....................... . …... For sale only................ . …... Rented or Sold……… …… …... Held off Market……... ... …..... For Occ’l Use…..... ...... …..... Temp Occ by URE… …. …..... Other c ………...…… …….. …. Seasonal……………… ……… 140,365 124,391 81,258 43,133 15,975 12,310 3,060 934 836 7,480 2,094 1,364 4,021 3,665 141 , 533 125 , 944 82 , 578 43 , 366 15 , 590 11 , 835 3 , 179 735 940 6 , 981 1 , 973 1 , 225 3 , 783 3 , 754 1,168 1,553 1,320 233 - 385 - 475 119 - 199 104 - 499 - 121 - 139 - 238 89 X 258 493 574 335 293 119 56 57 231 160 121 149 225 X 340 680 776 426 354 157 75 73 278 177 147 185 244 100.0 89 .0 58.3 30.6 11. 0 8.4 2.2 0.5 0.7 4.9 1.4 0.9 2.7 2.7 a The housing inventory estimates are benchmarked to the 2010 Census. b A margin of error is a measure of an estimate’s reliability. The larger the margin of error in relation to the size of the es timate, the less reliable the estimate. This number, when added to and subtracted from the estimate, forms the 90 percent confidence interval. c A detailed breakdown of the ‘other’ vacant category can be found in Historical Table 18 < www.census.gov/housing/hvs/data/histtabs � (r) Revised using vintage 201 9 housing unit controls. See note below. X Not Applicable. Since the number of housing units is set equal to an independent national measure, there is no sampling err or, and hence no confidence interval. 1. Since first quarter 2003, the Current Population Survey/Housing Vacancy Survey estim ates have been controlled to an independent set of housing unit estimates produced annually by the Census Bureau’s Population Division from Census 2000 and 2010 and updated using building p ermit data, estimates of housing loss, and other adminis trative record data. Doing so makes the CPS/HVS estimates of housing units more comparable to other Census Bureau housing sur veys controlled to these census - based estimates. The housing unit controls affect the estimate of vacant units in the sense that the estimates of total occupied and vacant units sum to the control total. Vacancy rates and homeownership rates are not affected by this change. 2. Beginning in the second quarter 2020 , the housing inventory estimates are based on vintage 20 19 housi ng unit controls that are projected forward through the current quarter 2020 . The first quarter 202 1 housing inventory estimates, shown above, reflect vintage 201 9 housing unit controls, benchmarked to the 2010 Census. The CPS/HVS historical table ser ies, from the first quarter 2010 through the second quarter 2020 , has also been revised based on vintage 201 9 housing unit controls. These r evised estimates and additional information on terms and definitions can be found at: www.census.gov/housing/hvs/data/histtabs � 3. For the methodology used in developing the housing unit estimates used for controls in the CPS/HVS, please see the Census Bureau’s Population Division website: www.census.gov/programs - surveys/popest .html � Source: U.S. Census Bureau, Current Populatio
5 n Survey/Housing Vacancy Survey, April
n Survey/Housing Vacancy Survey, April 27 , 2021 . Data Inquiries Media Inquiries Social, Economic & Housing Statistics Division, Financial & Market Characteristics Branch Public Information Office 301 - 763 - 3199 / Robert Callis / Patricia Holley / Daniel Truver 301 - 763 - 3030 sehsd.financial.market.characteristics@census.gov pio@census.gov The homeownership rate of 6 5. 6 percent was not statistically different from the rate in the first quarter 2021 (6 5. 3 per cent) and not statistically different from the rate in the fourth quarter 2020 ( 6 5.8 percent). Table 4. Homeownership Rates for the United States: 2000 to 2021 Year Homeownership Rates (percent) First Quarter Second Quarter Third Quarter Fourth Quarter Rate MOE a Rate MOE a Rate MOE a Rate MOE a 2021 …….. 2020…….. 65.6 65.3 0.5 0.5 67.9 0.5 67.4 0.5 65.8 0.5 2019…….. 2018…….. 2017…….. 2016…….. 2015…….. 2014…….. 2013…….. 2012…….. 64.2 64.2 63.6 63.5 63.7 64.8 65.0 65.4 0.5 0.5 0.5 0.5 0.5 0.5 0.5 0.5 64.1 64.3 63.7 62.9 63.4 64.7 65.0 65.5 0.5 0.5 0.5 0.5 0.5 0.5 0.5 0.5 64.8 64.4 63.9 63.5 63.7 64.4 65.3 65.5 0.5 0.5 0.5 0.5 0.5 0.5 0.5 0.5 65.1 64.8 64.2 63.7 63.8 64.0 65.2 65.4 0.5 0.5 0.5 0.5 0.5 0.5 0.5 0.5 2011…….. 66.4 0.5 65.9 0.5 66.3 0.5 66.0 0.5 2010…….. 2009…….. 2008…….. 2007…….. 2006…….. 2005…….. 2004…….. 2003…….. 2002 b ……. 2001…….. 2000…….. 67.1 67.3 67.8 68.4 68.5 69.1 68.6 68.0 67.8 67.5 67.1 0.5 0.5 0.5 0.5 0.5 0.5 0.3 0.3 0.3 0.3 0.3 66.9 67.4 68.1 68.2 68.7 68.6 69.2 68.0 67.6 67.7 67.2 0.5 0.5 0.5 0.5 0.5 0.5 0.2 0.3 0.3 0.3 0.3 66.9 67.6 67.9 68.2 69.0 68.8 69.0 68.4 68.0 68.1 67.7 0.5 0.5 0.5 0.5 0.5 0.5 0.2 0.3 0.3 0.3 0.3 66.5 67.2 67.5 67.8 68.9 69.0 69.2 68.6 68.3 68.0 67.5 0.5 0.5 0.5 0.5 0.5 0.5 0.3 0.3 0.3 0.3 0.3 a A margin of error is a measure of an estimate’s reliability. The larger the margin of error in relation to the size of the estimate, the less reliable the estimat e. This number, when added to and subtracted from the estimate, forms the 90 percent confidence interval. b Revised in 2002 to incorporate information collected in Census 2000. Source: U.S. Census Bureau, Current Population Survey/Housing Vacancy Survey , April 27 , 2021 . 62 63 64 65 66 67 68 69 70 1998 2002 2006 2010 2014 2018 2021 Percent Recession Homeownership Rate Seasonally Adjusted Homeownership Rate Quarterly Homeownership Rates and Seasonally Adjusted Homeownership Rates for the United States: 1998 - 2021 Figure 4 Source: U.S. Census Bureau, Current Population Survey/Housing Vacancy Survey, April 27 , 2021 , Recession data: National Bureau of Economic Research, www.nber.org Data Inquiries Media Inquiries Social, Economic & Housing Statistics Division, Financial & Market Characteristics Branch Public Information Office 301 - 763 - 3199 / Robert Callis / Patricia Holley / Daniel Truver 301 - 763 - 3030 sehsd.financial.market.characteristics@census.gov pio@census.gov Table 4SA shows the seasonally adjusted homeownership rates for the United States, from 2000 through the first
6 quarter 2021 . (Research has shown th
quarter 2021 . (Research has shown that seasonality for homeownership rates is present . ) When adjusted for seasonal variation, the first quar ter 2021 homeownersh ip rate was not statistically different from the rate in the first quarter 2020 or the rate in the fourth quarter 2020 . Table 4SA. Homeownership Rates for the United States: 2000 to 2021 , Seasonally Adjusted a Year Homeownership Rates (percent), Seasonally Adjusted First Quarter Second Quarter Third Quarter Fourth Quarter Rate MOE b Rate MOE b Rate MOE b Rate MOE b 2021…….. 2020…….. 65.6 65. 3 0.5 0.5 68. 1 0.5 67. 3 0.5 65. 7 0.5 2019…….. 2018…….. 2017…….. 2016…….. 2015…….. 2014…….. 2013…….. 2012…….. 64. 2 64. 2 63. 6 63. 5 63.8 64.9 65.2 65.6 0.5 0.5 0.5 0.5 0.5 0.5 0.5 0.5 64.3 64. 5 63. 9 63. 1 63. 5 64.8 65.1 65.6 0.5 0.5 0.5 0.5 0.5 0.5 0.5 0.5 64. 7 64. 4 63. 9 63. 4 63.6 64.3 65.2 65.4 0.5 0.5 0.5 0.5 0.5 0.5 0.5 0.5 64.9 64.6 64. 0 63. 5 63.7 63.9 65.1 65.3 0.5 0.5 0.5 0.5 0.5 0.5 0.5 0.5 2011…….. 66.5 0.5 66.0 0.5 66.1 0.5 65.9 0.5 2010…….. 2009…….. 2008…….. 2007…….. 2006…….. 2005…….. 2004…….. 2003…….. 2002 c ……. 2001…….. 2000…….. 67.2 67.4 67.9 68.5 68.6 69.2 68.7 68.1 67.9 67.6 67.1 0.5 0.5 0.5 0.5 0.5 0.5 0.2 0.2 0.2 0.2 0.2 66.9 67.4 68.1 68.3 68.8 68.7 69.4 68.2 67.8 67.8 67.3 0.5 0.5 0.5 0.5 0.5 0.5 0.1 0.2 0.2 0.2 0.2 66.7 67.4 67.7 68.0 68.9 68.7 68.9 68.3 67.9 67.9 67.5 0.5 0.5 0.5 0.5 0.5 0.5 0.1 0.2 0.2 0.2 0.2 66.5 67.2 67.5 67.8 68.8 68.9 69.1 68.5 68.2 67.9 67.5 0.5 0.5 0.5 0.5 0.5 0.5 0.2 0.2 0.2 0.2 0.2 a As new quarterly data are input, previous quarters’ seasonally adjusted homeownership rates may change. b A margin of error is a measure of an estimate’s reliability. The larger the margin of error in relation to the size of the es timate, the less reliable the estimate. This number, when added to and subtracted from the esti mate, forms the 90 percent confidence interval. c Revised in 2002 to incorporate information collected in Census 2000. Source: U.S. Census Bureau, Current Population Survey/Housing Vacancy Survey , April 27 , 2021 . Data Inquiries Media Inquiries Social, Economic & Housing Statistics Division, Financial & Market Characteristics Branch Public Information Office 301 - 763 - 3199 / Robert Callis / Patricia Holley / Daniel Truver 301 - 763 - 3030 sehsd.financial.market.characteristics@census.gov pio@census.gov The first quarter 2021 homeownership rate was highest in the Midwest (70. 3 percent), followed by the South (67. 4 percent), Northeast (6 3.1 percent), and West ( 59.7 percent). The homeownership rate in the Midwest was higher than the rate in the first quarter 2020 , while the rate s in the Northeast , South, and West w ere not statistically different . Table 5. Homeownership Rates for the United States and Regions: 201 6 to 2021 Homeownership Rates (percent) Year/Quarter United States Northeast Midwest South West Rate MOE a Rate MOE a Rate MOE a Rate MOE a Rate MOE a 2021 First Quarter 2020 Fourth Quarter Third Quarter Second Quarter Fir
7 st Quarter 2019 Fourth Quarter T
st Quarter 2019 Fourth Quarter Third Quarter Second Quarter First Quarter 2018 Fourth Quarter Third Quarter Second Quarter First Quarter 2017 Fourth Quarter Third Quarter Second Quarter First Quarter 2016 Fourth Quarter Third Quarter Second Quarter First Quarter 2015 Fourth Quarter Third Quarter Second Quarter First Quarter 2014 Fourth Quarter Third Quarter Second Quarter First Quarter 65.6 65.8 67.4 67.9 65.3 65.1 64.8 64.1 64.2 64.8 64.4 64.3 64.2 64.2 63.9 63.7 63.6 63.7 63.5 62.9 63.5 63.8 63.7 63.4 63.7 64.0 64.4 64.7 64.8 0.5 0.5 0.5 0.5 0.5 0.5 0.5 0.5 0.5 0.5 0.5 0.5 0.5 0.5 0.5 0.5 0.5 0.5 0.5 0.5 0.5 0.5 0.5 0.5 0.5 0.5 0.5 0.5 0.5 63.1 62.6 62.0 63.3 62.4 62.3 61.7 61.2 60.7 61.3 61.5 61.3 60.5 60.6 60.4 60.4 60.6 60.4 60.8 59.2 60.4 61.6 60.8 60.2 61.1 61.9 62.3 62.1 62.4 0.7 0.7 0.7 0.7 0.7 0.7 0.7 0.7 0.8 0.8 0.8 0.8 0.8 0.8 0.8 0.8 0.8 0.9 0.9 0.9 0.9 0.9 0.9 0.9 0.9 0.9 0.9 0.9 0.9 70.3 70.8 71.2 71.4 69.2 69.5 69.0 68.0 68.2 69.3 69.0 68.3 67.9 68.7 69.1 68.0 67.6 68.4 68.6 67.7 68.9 68.1 68.1 68.4 68.6 68.3 68.8 69.6 69.3 0.6 0.6 0.6 0.6 0.6 0.6 0.6 0.6 0.6 0.6 0.6 0.6 0.7 0.6 0.6 0.7 0.7 1.0 1.0 1.0 1.0 1.0 1.0 1.0 1.0 1.0 1.0 1.0 1.0 67.4 67.7 70.8 71.1 67.6 66.7 66.2 66.0 66.2 66.0 65.4 65.9 66.3 65.8 65.5 65.5 65.4 65.3 65.0 64.8 64.8 65.3 65.4 64.9 65.1 65.5 65.7 65.9 66.5 0.5 0.5 0.5 0.5 0.5 0.5 0.6 0.6 0.6 0.6 0.6 0.6 0.6 0.6 0.6 0.6 0.6 0.9 0.9 0.9 0.9 0.9 0.9 0.9 0.9 0.9 0.9 0.9 0.9 59.7 60.4 62.1 62.6 60.1 60.3 60.6 59.3 59.8 60.9 60.2 59.7 59.7 60.0 58.9 58.9 59.0 59.0 58.2 57.9 58.7 59.0 58.7 58.5 58.5 58.6 59.4 59.6 59.4 0.7 0.7 0.7 0.7 0.7 0.7 0.7 0.7 0.7 0.7 0.7 0.7 0.7 0.7 0.7 0.7 0.7 1.1 1.1 1.1 1.1 1.2 1.2 1.2 1.2 1.2 1.2 1.2 1.2 a A margin of error is a measure of an estimate’s reliability. The larger the margin of error in relation to the size of the esti mate, the less reliable the estimate. This number, when added to and subtracted from the estimate, forms the 90 percent confidence interval. Source: U.S. Census Bureau, Current Population Survey/Housing Vacancy Survey, April 27 , 2021 . Data Inquiries Media Inquiries Social, Economic & Housing Statistics Division, Financial & Market Characteristics Branch Public Information Office 301 - 763 - 3199 / Robert Callis / Patricia Holley / Daniel Truver 301 - 763 - 3030 sehsd.financial.market.characteristics@census.gov pio@census.gov The first quarter 2021 homeownership rate was highest for those householders aged 65 years and over ( 79.3 percent) and lowest for those householders under 35 years of age ( 38. 1 percent). The first quarter 2021 rates of all a ge groups were not statistically different from the rates in first quarter 2020 . Table 6. Homeownership Rates by Age of Householder: 2016 to 2021 Year/Quarter Homeownership Rates (percent) U
8 nited States Under 35 years 35 to 44
nited States Under 35 years 35 to 44 years 45 to 54 years 55 to 64 years 65 years and over Rate MOE a Rate MOE a Rate MOE a Rate MOE a Rate MOE a Rate MOE a 2021 First Quarter 2020 Fourth Quarter Third Quarter Second Quarter First Quarter 2019 Fourth Quarter Third Quarter Second Quarter F irst Quarter 2018 Fourth Quarter Third Quarter Second Quarter First Quarter 2017 Fourth Quarter Third Quarter Second Quarter First Quarter 2016 Fourth Quarter Third Quarter Second Quarter First Quarter 2015 Fourth Quarter Third Quarter Second Quarter First Quarter 2014 Fourth Quarter Third Quarter Second Quarter First Quarter 65.6 65.8 67.4 67.9 65.3 65.1 64.8 64.1 64.2 64.8 64.4 64.3 64.2 64.2 63.9 63.7 63.6 63.7 63.5 62.9 63.5 63.8 63.7 63.4 63.7 64.0 64.4 64.7 64.8 0.5 0.5 0.5 0.5 0.5 0.5 0.5 0.5 0.5 0.5 0.5 0.5 0.5 0.5 0.5 0.5 0.5 0.5 0.5 0.5 0.5 0.5 0.5 0.5 0.5 0.5 0.5 0.5 0.5 38.1 38.5 40.2 40.6 37.3 37.6 37.5 36.4 35.4 36.5 36.8 36.5 35.3 36.0 35.6 35.3 34.3 34.7 35.2 34.1 34.2 34.7 35.8 34.8 34.6 35.3 36.0 35.9 36.2 0.7 0.7 0.8 0.8 0.7 0.7 0.7 0.7 0.7 0.7 0.7 0.7 0.7 0.7 0.7 0.7 0.7 0.8 0.8 0.8 0.8 0.8 0.8 0.8 0.8 0.8 0.9 0.9 0.9 0.8 62.0 61.0 63.9 64.3 61.5 60.4 60.3 59.4 60.3 61.1 59.5 60.0 59.8 58.9 59.3 58.8 59.0 58.7 58.4 58.3 58.9 59.3 58.1 58.0 58.4 58.8 59.1 60.2 60.7 0.7 0.7 0.7 0.7 0.8 0.8 0.8 0.8 0.8 0.8 0.8 0.8 0.8 0.8 0.8 0.8 0.8 1.0 1.0 1.0 1.0 1.0 1.0 1.0 1.0 1.0 1.0 1.0 1.0 69.4 69.8 72.0 72.2 70.3 70.6 70.1 70.1 69.5 70.1 69.7 70.6 70.0 69.5 69.1 69.3 69.4 69.8 69.1 69.1 69.2 70.1 69.9 69.9 70.1 70.5 70.1 70.7 71.4 0.7 0.7 0.7 0.7 0.7 0.7 0.7 0.7 0.7 0.7 0.7 0.7 0.7 0.7 0.7 0.7 0.7 0.9 0.9 0.9 0.9 0.9 0.9 0.9 0.9 0.9 0.9 0.9 0.9 75.7 76.0 76.4 77.4 76.3 75.6 75.1 74.8 75.4 75.5 75.6 75.1 75.4 75.3 75.0 75.4 75.6 74.8 74.9 74.7 75.7 75.2 75.3 75.4 75.8 75.8 76.6 76.4 76.4 0.7 0.6 0.6 0.6 0.6 0.7 0.7 0.7 0.7 0.7 0.7 0.7 0.7 0.7 0.7 0.7 0.7 0.6 0.6 0.6 0.6 0.6 0.6 0.6 0.6 0.6 0.6 0.6 0.6 79.3 80.2 80.7 80.4 78.7 79.0 78.9 78.0 78.5 78.8 78.6 78.0 78.5 79.2 78.9 78.2 78.6 79.5 79.0 77.9 78.8 79.3 78.7 78.5 79.0 79.5 80.0 80.1 79.9 0.5 0.5 0.5 0.5 0.5 0.5 0.5 0.5 0.5 0.5 0.5 0.5 0.5 0.5 0.5 0.6 0.5 0.7 0.7 0.7 0.7 0.7 0.7 0.7 0.7 0.7 0.7 0.7 0.7 a A margin of error is a measure of an estimate’s reliability. The larger the margin of error in relation to the size of the es timate, the less reliable the estimate. This number, when added to and subtracted from the estimate, forms the 90 percent confidence interval. Source: U.S. Census Bureau, Current Population Survey/Housing Vacancy Survey, April 27 , 2021 . Data Inquiries Media Inquiries Social, Economic & Housing Statistics Division, Fin
9 ancial & Market Characteristics Branch
ancial & Market Characteristics Branch Public Information Office 301 - 763 - 3199 / Robert Callis / Patricia Holley / Daniel Truver 301 - 763 - 3030 sehsd.financial.market.characteristics@census.gov pio@census.gov For homeownership rates by race , the first quarter 2021 homeownership rate for non - Hispanic White Alone householders reporting a single race was highest at 73.8 percent. The rate for Asian, Native Hawaiian and Pacific Islander Alone householders was second at 59. 6 percent and the rate for Black Alone householders was lowest at 4 5 .1 percent. The homeownership rate for Black Alone householders was higher than the r ate in the first quarter 2020 while all other categories were not statistically different . Table 7. Homeownership Rates by Race and Ethnicity of Householder: 2017 to 2021 Homeownership Rates (percent) Year/Quarter United States Non - Hispanic White Alone Black Alone All Other Races Hispanic (of any race) Total a Asian, Native , Hawaiian and Pacific Islander Alone Rate MOE b Rate MOE b Rate MOE b Rate MOE b Rate MOE b Rate MOE b 2021 First Quarter 2020 Fourth Quarter Third Quarter Second Quarter First Quarter 2019 Fourth Quarter Third Quarter Second Quarter First Quarter 2018 Fourth Quarter Third Quarter Second Quarter First Quarter 2017 Fourth Quarter Third Quarter Second Quarter First Quarter 2016 Fourth Quarter Third Quarter Second Quarter First Quarter 65.6 65.8 67.4 67.9 65.3 65.1 64.8 64.1 64.2 64.8 64.4 64.3 64.2 64.2 63.9 63.7 63.6 63.7 63.5 62.9 63.5 0.5 0.5 0.5 0.5 0.5 0.5 0.5 0.5 0.5 0.5 0.5 0.5 0.5 0.5 0.5 0.5 0.5 0.5 0.5 0.5 0.5 73.8 74.5 75.8 76.0 73.7 73.7 73.4 73.1 73.2 73.6 73.1 72.9 72.4 72.7 72.5 72.2 71.8 72.2 71.9 71.5 72.1 0.4 0.4 0.4 0.4 0.4 0.4 0.4 0.4 0.4 0.4 0.4 0.4 0.4 0.4 0.4 0.4 0.4 0.4 0.4 0.4 0.4 45.1 44.1 46.4 47.0 44.0 44.0 42.7 40.6 41.1 42.9 41.7 41.6 42.2 42.1 42.0 42.3 42.7 41.7 41.3 41.7 41.5 0.9 0.9 0.9 0.9 0.9 0.9 0.9 0.9 0.9 0.9 0.9 0.9 0.9 0.9 0.9 0.9 0.9 0.9 0.9 0.9 0.9 57.1 56.3 58.0 59.3 55.9 55.7 56.0 55.0 53.9 55.6 56.6 55.7 54.8 55.4 54.7 54.3 53.6 53.7 53.3 51.2 53.0 1.1 1.1 1.1 1.1 1.1 1.1 1.1 1.1 1.1 1.1 1.1 1.1 1.1 1.1 1.2 1.2 1.1 1.0 1.1 1.1 1.1 59.6 59.5 61.0 61.4 59.1 57.6 58.5 57.7 56.9 58.1 58.2 58.0 57.3 58.2 57.1 56.5 56.8 56.6 55.6 53.7 55.7 1.3 1.3 1.3 1.3 1.3 1.3 1.3 1.3 1.3 1.3 1.3 1.3 1.4 1.4 1.4 1.4 1.4 1.3 1.3 1.3 1.3 49.3 49.1 50.9 51.4 48.9 48.1 47.8 46.6 47.4 46.9 46.3 46.6 48.4 46.6 46.1 45.5 46.6 46.3 47.0 45.1 45.3 0.9 0.9 0.9 0.9 0.9 0.9 0.9 0.9 0.9 0.9 0.9 1.0 1.0 1.0 1.0 1.0 1.0 0.9 0.9 0.9 0.9 a Includes people who reported Asian, Native Hawaiian or Other Pacific Islander, or American Indian or Alaska Native regardless of whether they reported any other race, as well as all other combinations of two or more races. b A margin of error is a measure of an
10 estimate’s variability. The larger the
estimate’s variability. The larger the margin of error in relation to the size of the estimate, the less reliab le the estimate. This number, when added to and subtracted from the estimate, forms the 90 percent confidence interval. Source: U .S. Census Bureau, Current Population Survey/Housing Vacancy Survey, April 27 , 2021 . Data Inquiries Media Inquiries Social, Economic & Housing Statistics Division, Financial & Market Characteristics Branch Public Information Office 301 - 763 - 3199 / Robert Callis / Patricia Holley / Daniel Truver 301 - 763 - 3030 sehsd.financial.market.characteristics@census.gov pio@census.gov The first quarter 2021 homeownership rate for households with family income greater than or equal to the median family income ( 79.4 percent) was not statistically different from t he first quarter 2020 rate (78. 8 percent) . The rate for those households with family income less than the median family income ( 51.7 percent) was not statistically different from the first quarter 2020 rate (5 1. 8 percent) . Table 8. Homeownership Rates by Family Income: 2016 to 2021 Homeownership Rates (percent) Year/Quarter United States Households with family income greater than or equal to the median family income a Households with family income less than the median family income a Rate MOE b Rate MOE b Rate MOE b 2021 First Quarter 2020 Fourth Quarter Third Quarter Second Quarter First Quarter 2019 Fourth Quarter Third Quarter Second Quarter First Quarter 2018 Fourth Quarter Third Quarter Second Quarter First Quarter 2017 Fourth Quarter Third Quarter Second Quarter First Quarter 2016 Fourth Quarter Third Quarter Second Quarter First Quarter 2015 Fourth Quarter Third Quarter Second Quarter First Quarter 2014 Fourth Quarter Third Quarter Second Quarter First Quarter 65.6 65.8 67.4 67.9 65.3 65.1 64.8 64.1 64.2 64.8 64.4 64.3 64.2 64.2 63.9 63.7 63.6 63.7 63.5 62.9 63.5 63.8 63.7 63.4 63.7 64.0 64.4 64.7 64.8 0.5 0.5 0.5 0.5 0.5 0.5 0.5 0.5 0.5 0.5 0.5 0.5 0.5 0.5 0.5 0.5 0.5 0.5 0.5 0.5 0.5 0.5 0.5 0.5 0.5 0.5 0.5 0.5 0.5 79.4 79.4 80.2 80.5 78.8 78.8 78.7 78.2 78.0 78.9 78.2 78.3 78.3 78.2 78.4 77.9 77.9 78.0 77.8 77.8 78.1 78.5 78.4 78.3 78.4 79.0 79.3 79.5 79.8 0.5 0.5 0.4 0.4 0.5 0.5 0.5 0.5 0.5 0.5 0.5 0.5 0.5 0.5 0.5 0.5 0.5 0.4 0.4 0.4 0.5 0.5 0.5 0.5 0.5 0.5 0.5 0.5 0.5 51.7 52.3 54.7 55.2 51.8 51.4 50.9 50.0 50.5 50.7 50.5 50.2 50.0 50.2 49.5 49.5 49.3 49.5 49.2 48.0 48.9 49.2 49.0 48.6 48.9 49.0 49.5 49.8 49.8 0.6 0.6 0.6 0.6 0.6 0.6 0.6 0.6 0.6 0.6 0.6 0.6 0.6 0.6 0.6 0.6 0.6 0.6 0.6 0.6 0.5 0.5 0.5 0.5 0.5 0.5 0.5 0.5 0.5 a Based on family or primary individual income. b A margin of error is a measure of an estimate’s reliability. The larger the margin of error in relation to the size of the es timate, the less reliable the estimate. This number, when added to and subtracted from the estimate, fo rms the 90 percent confidence interval. Source: U.S. Census Bureau, Current Population Survey/Housing Vac
11 ancy Survey, April 27 , 2021 .
ancy Survey, April 27 , 2021 . Data Inquiries Media Inquiries Social, Economic & Housing Statistics Division, Financial & Market Characteristics Branch Public Information Office 301 - 763 - 3199 / Robert Callis / Patricia Holley / Daniel Truver 301 - 763 - 3030 sehsd.financial.market.characteristics@census.gov pio@census.gov The second quarter 202 1 data are scheduled for release on July 27 , 2021 . View the full schedule in the Economic Briefing Room: https://census.gov/economic - indicators/ �. More details can be found at www.census.gov/housing/hvs �. Note: Impac ts of the coronavirus (COVID - 19) pandemic on Housing Vacancies and Homeownership data collection for the First Quarter 2021 On March 20, 2020, the Census Bureau suspended in - person interviews, and this continued through June 2020. Beginning in July 2020 , parts of the country began reopening for personal interviewing. Personal interviewing was allowed for 97 percent of sample cases in January 2021 , 97 percent of sample cases in February, and 99 percent of sample cases in March. The Census Bureau cont inued to conduct the remaining CPS/HVS interviews by telephone and made efforts to collect telephone interviews for households and vacant units that would normally have been personal interviews. Households are in the survey’s sample for a total of 8 month s, meaning that Field Representatives attempt to interview someone in the household each of those 8 months. Generally, households entering the sample for their first month and fifth month are interviewed through a personal visit. Interviews for other mont hs could also be conducted by phone under certain conditions. For a full explanation of the CPS sampling scheme, see: https://www.census.gov/programs - surveys/cps/technical - documentation/methodology.html� Data are generally collected the week of the 19 th and the reference period is the time of interview. The response rate was 78 percent for January, 78 percent for February, and 77 percent for March 2021. For comparison, the average response rate for January, February, and March 2020 was 79 percent. T he estimation methodology was not changed in response to the coronavirus pandemic. The lower response rate is addressed by the weights. We likely cannot fully understand or quantify the effects of the pandemic on the CPS/HVS data and estimates. This not e is intended only to document the changes to data collection operations made in response to the coronavirus pandemic. EXPLANATORY NOTES The estimates in this release are based on a sample survey and therefore are subject to both sampling and non - samplin g error. Sampling error is a result of not surveying the entire population. Non - sampling error occurs because accurate information cannot always be obtained. The sample estimate and its standard error enable one to construct a margin of error. A margin of error is a measure of an estimate’s reliability. The larger a margin of error is in relation to the size of the estimate, the less reliable the estimate. For example, the standard error on the estimated rental vacancy rate of 6. 8 percent is 0. 1 50 percentage points. The margin of error, at the 90 percent confidence interval, is calculated as 1.645 x 0. 1 50 percent, or 0. 2 4 7 percent age points . Thus , the 90 percent confidence interval is from 6. 6 percent to 7.0 percent. If all possible samples were surveyed under essentially the same general conditions and the same sample design, and if an estimate and its standard error were calculated from each sample, then approx imately 90 percent of the margins of error would include the average result of all possible samples. In the first quart
12 er 2017, the parameters used to calculat
er 2017, the parameters used to calculate standard errors for rates and estimates were updated. The factors are evaluated, and updated i f necessary, after approximately 15 months of data have been collected from a new C urrent Population Survey/Housing Vacancy Survey (C PS/HVS ) sample following a Data Inquiries Media Inquiries Social, Economic & Housing Statistics Division, Financial & Market Characteristics Branch Public Information Office 301 - 763 - 3199 / Robert Callis / Patricia Holley / Daniel Truver 301 - 763 - 3030 sehsd.financial.market.characteristics@census.gov pio@census.gov decennial census. The current sample has been fully phased - in since July 2015. Since the first quarter 2003, the C PS/HVS housing inventory estimates have been controlled to independent housing unit estimates based upon Census 2000 (2000 - 2009 data) and C ensus 2010 (2010 - present data) and updated with building permit data, estimates of housing loss, and other administrative records data. In the second quarter 2020 , the CPS/HVS revised the series of housing inventory estimates back to the first quarter 2010 , based on the latest series of independent housing controls, the vintage 201 9 time series. Housing inventory estimates from the second quarter 2000 through the fourth quarter 2009 are revised based on the vintage 2010 time series. Housing inventory estima tes prior to the second quarter 2000 have not been revised. The CPS/HVS housing inventory data series are based on the independently produced vintage 201 9 housing unit estimates that are projected forward through the first quarter 2 0 21 . The vintage 201 9 es timates are benchmarked to the 2010 Census. The same general procedure will be followed each year in revising housing inventory estimates with the most up - to - date independent housing estimates available. For an explanation of the methodology used i n producing the housing inventory independent estimates, please see : www.census.gov/programs - surveys/popest .html � Note: This time series is by the latest "vintage" year. For example, vintage 201 9 means that all of the estimates in this time series are identified as belonging to " vintage 201 9 ." The 2010 data are from the 201 9 vintage , the 2011 data are from the 201 9 vintage , and so on. The CPS/HVS also began computing first - stage factors (used for weighting purposes) based on year - round and seasonal counts of housing units from Census 2000 for the first quarter 2003. From 1980 to 2002, the CPS/HVS first - stage factors were based on year - r ound estimates only. The effect on the data is slight and the change should improve the counts of year - round and seasonal units. For more information on the effects of these changes, please see the Source and Accuracy Statement at: www.census.gov/housing/hvs/files/qtr121/source_21q1.pdf � Beginning in the first quarter 2012, the population controls reflect the results of the 2010 Decennial Census. This change has virtually no e ffect on vacancy and homeownership rates. Research has shown that the new 2010 - based controls increased the rental vacancy rate in April 2010 from 10.43 percent to 10.45 percent - a difference of less than 1/10 of one percent. The homeowner vacancy rate re mained the same at 2.63 percent, while the homeownership rate was up from 66.67 percent to 66.74 percent. The question on race on the CPS was modified beginning in the first quarter 2003 to comply with new standards for federal statistical agencies. Respondents are now allowed to report one or more races. The question on Hispanic origin is asked separately, and is asked before the question on race. First - stage factors for year - round vacant units
13 have been corrected as of the second qu
have been corrected as of the second quarter 2004. Research has shown that this correction had no significant effect on the vacancy rates or homeownership rates. The rental vacancy rate is the proportion of the rental inventory that is vacant for rent. In tables 1 and 2, the rates are compute d using the following formula. Data Inquiries Media Inquiries Social, Economic & Housing Statistics Division, Financial & Market Characteristics Branch Public Information Office 301 - 763 - 3199 / Robert Callis / Patricia Holley / Daniel Truver 301 - 763 - 3030 sehsd.financial.market.characteristics@census.gov pio@census.gov �݁݊ݐ݈ܽ ܸܽܿܽ݊ܿ� �ܽݐ݁ ( % ) = ۏ ێ ێ ێ ێ ۍ ܸܽܿܽ݊ݐ �݁ܽݎ − ݎݑ݊݀ ݑ݊�ݐݏ ݂ݎ ݎ݁݊ݐ ( �݁݊ݐ݁ݎ ܿܿݑ�݁݀ ݑ݊�ݐݏ ) + ( ܸܽܿܽ݊ݐ �݁ܽݎ − ݎݑ݊݀ ݑ݊�ݐݏ ݎ݁݊ݐ݁݀ ܾݑݐ ܽ�ܽ�ݐ�݊ ݃ ܿܿݑܽ݊ܿ� ) + ( ܸܽܿܽ݊ݐ �݁ܽݎ − ݎݑ݊݀ ݑ݊�ݐݏ ݂ݎ ݎ݁݊ݐ ) ے ۑ ۑ ۑ ۑ ې ∗ 100 The homeowner vacancy rate is the proportion of the homeowner inventory that is vacant for sale. In tables 1 and 2 the rates are computed using the following formula. � ݉݁�݊݁ݎ ܸܽܿܽ݊ܿ� �ܽݐ݁ ( % ) = ۏ ێ ێ ێ ێ ۍ ܸܽܿܽ݊ݐ �݁ܽݎ − ݎݑ݊݀ ݑ݊�ݐݏ ݂ݎ ݏ݈ܽ݁ ݈݊� ( ��݊݁ݎ ܿܿݑ�݁݀ ݑ݊�ݐݏ ) + ( ܸܽܿܽ݊ݐ �݁ܽݎ − ݎݑ݊݀ ݑ݊�ݐݏ ݏ݈݀ ܾݑݐ ܽ�ܽ�ݐ�݊݃ ܿܿݑܽ݊ܿ� ) + ( ܸܽܿ ܽ݊ݐ �݁ܽݎ − ݎݑ݊݀ ݑ݊�ݐݏ ݂ݎ ݏ݈ܽ݁ ݈݊� ) ے ۑ ۑ ۑ ۑ ې ∗ 100 The homeownership rate is the proportion of households that is owner - occupied. It is computed by dividing the number of households that are occupied by owners by the total number of occupied households (tables 4, 4SA and 5). �݉݁݊�݁ݎݏ ℎ � � ܽ ݐ݁ ( % ) = [ ��݊݁ݎ ܿܿݑ�݁݀ ℎ ݑݏ�݊݃ ݑ݊�ݐݏ �ݐ݈ܽ �ܿܿݑ�݁݀ ℎ ݑݏ�݊݃ ݑ݊�ݐݏ ] ∗ 100 For the homeownership rate for a specific characteristic (tables 6, 7 and 8), use the owner and total number of units for that charact eristic. For example, for the West region: �݉݁݊�݁ݎݏ ℎ � �ܽݐ݁ ( ܹ݁ݏݐ ) ( % ) = [ ��݊݁ݎ ܿܿݑ�݁݀ ℎ ݑݏ�݊݃ ݑ݊�ݐݏ ( ܹ݁ݏݐ ) �ݐ݈ܽ �ܿܿݑ�݁݀ ℎ ݑݏ�݊݃ ݑ݊�ݐݏ ( ܹ݁ݏݐ ) ] ∗ 100 RESOURCES API The Census Bureau’s application programming interface, available at www.census.gov/developers/ �, lets developers create custom apps to reach new users and makes key demographic, socio - economic and housing statistics more accessible than ever before. FRED Mobile App Receive the latest updates on the nation’s key economic indicators by downloading the FRED App https://fred.stlouisfed.org/fred - mobile/ � for both Apple and Android devices. FRED, the signature database of the Federal Reserve Bank of St. Louis, now incorporates the Census Bureau’s 13 economic indicators. #