

A comparative risk assessment approach using health record linkage Thursday 15 th September 2016 Elaine Tod NHS Health Scotland Objectives Comparative risk assessment approach Background to Global Burden of Disease GBD risk factor work ID: 1014594
Download Presentation The PPT/PDF document "To what extent can the burden of disease..." is the property of its rightful owner. Permission is granted to download and print the materials on this web site for personal, non-commercial use only, and to display it on your personal computer provided you do not modify the materials and that you retain all copyright notices contained in the materials. By downloading content from our website, you accept the terms of this agreement.


1. To what extent can the burden of disease in Scotland be explained by modifiable risk factors? A comparative risk assessment approach using health record linkageThursday 15th September 2016Elaine Tod, NHS Health Scotland
2. ObjectivesComparative risk assessment approachBackground to Global Burden of Disease (GBD) risk factor workCurrent GBD methodologyThe National Burden of Disease, Injuries & Risk Factors Study for ScotlandStroke pilot studyMethodologyResults from the stroke pilotStrengths & limitations Planned work
3. The Comparative risk assessment (CRA)“the systematic evaluation of the changes in population health which result from modifying the population distribution of exposure to a risk factor or a group of risk factors.”Source: Ezzati, M. Annex 4.1: Comparative Risk Assessment in the Global Burden of Disease Study and the Environmental Health RisksThe CRA an be a useful tool for decision-makers when setting priorities, particularly when the question we are asking is “how much good can we do with the resources we have?” or “what proportion of a specific health outcome is explained by a key risk factor or group of risk factorsImage source: http://piperreport.com/blog/2012/11/04/price-transparency-guidelines-for-healthcarepurchasers/
4. Background to Global Burden of Disease risk factor workWorld Bank commissioned first GBD study in 1992 reporting results for 10 risk factors globally and for 8 broad regions. Several methodological advances since then for the risk factor workMain advancesAbility to analyse risk factors as continuous covariates rather than simply dichotomousCalculation of PAFs at country levelEvolving ways of defining minimum risk
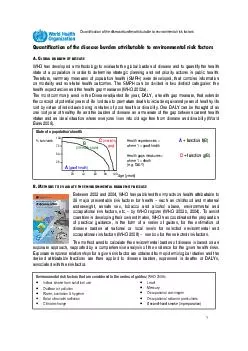
5. IHME methodologyKey metric: Population Attributable Fraction“the proportional reduction in population disease or mortality that would occur if exposure to a risk factor were reduced to an alternative ideal exposure scenario (e.g. no tobacco use)”World Health Organizationwww.who.int/healthinfo/global_burden_disease/metrics_paf/en/Methods evolved with each iterationData on exposure prevalenceSynthesised using a Bayesian meta-regression method, DisMod-MR or spatial-temporal Gaussian process regressionRelative risksBased on meta-regressions of published cohort studies and intervention studiesEvidence of appropriate counterfactual risk level or distributionBased on systematic reviews of the literatureData became available at Scotland level for the first time in the 2015 GBD update
6. The National Burden of Disease, Injuries & Risk Factors study in Scotland
7. To explore the possibility of using Scottish survey data on exposure prevalence linked to routine administrative data on hospitalisations and mortality as a means of carrying out the comparative risk assessment element of the national burden of disease studyOverarching aim
8. Stroke pilot study aimTo what extent can the burden of stroke in Scotland be explained by modifiable risk factors?
9. Stroke pilot study methodology
10. Study design & populationThe study utilised pooled cohort data created through follow up for health outcomes (hospital admissions and death records) of 8 waves of the Scottish Health Survey (SHeS).The Scottish Health Survey is intended to provide a comprehensive picture of the health of the population living in private households.Between 85.6% and 92.8% of SHeS respondents agreed to their survey data being linked to routine hospital admission data for all eight waves between 1995 and 2012.In total 49,451 adults who consented to linkage were technically able to be followed up using their Community Health Index (CHI) identifier.Adult age ranges from 16-64 years in 1995, 16-74 years in 1998 and 16 years+ from 2003 onwards.
11. Total population years at risk contributed by each SHeS survey wave between 1995 and 2012
12. Exposure dataInterested in the contribution of modifiable risk factors in explaining stroke incidence in ScotlandA literature review to identify important risk factors for stroke and consulted a panel of stroke experts.Risk factors were organised hierarchically according to the layers of the Dahlgren & Whitehead model.
13. Identifying risk factors for stroke
14. Selecting risk factors for this study
15. Stroke outcome dataThree data sources were considered for linkage to the SHeSThe Scottish Stroke Care AuditThe Scottish Morbidity Record (SMR01)NRS Death records
16. Stroke outcome dataStroke is defined by the World Health Organization as:“rapidly developing clinical signs of focal (at times global) disturbance of cerebral function lasting more than 24 hours or leading to death with no apparent cause other than that of vascular origin”Source:http://www.who.int/healthinfo/statistics/bod_cerebrovasculardiseasestroke.pdf Stroke incidence was defined as either a first hospitalised admission for stroke in the primary diagnostic position on hospital discharge or a fatal event from stroke10 year look back periodSelf-reporting of a previous stroke
17. ICD coding was aligned with the national definition used in Scotland to report stroke mortality (includes ICD10 ‘I64’ and ICD9 ‘436)Stroke outcome data
18. Method: Missing dataTypes of missing data:Potentially valid but missing (e.g. refused, don’t know)Not valid and missing (e.g. question not applicable)Question not included in survey waveLess than half of the 49,451 survey respondents included in the baseline cohort had valid observations for all risk factor variables (n = 23,161).With a decline in survey response levels and consent to linkage, it was important to explore any potential bias in the data that may impact on the generalisability of the data to Scotland.Multiple Imputation via chained equations (MICE)Sensitivity analysis: MICE versus complete-case analysis
19. Population Attributable Fraction“the proportional reduction in population disease or mortality that would occur if exposure to a risk factor were reduced to an alternative ideal exposure scenario (e.g. no tobacco use)”World Health Organizationwww.who.int/healthinfo/global_burden_disease/metrics_paf/en/Concept introduced by Levin in 1953 in a study looking at the link between lung cancer and smoking.Many variations on the formula to address limitations of Levin’s formula. PAF RR(x) – relative risk at each exposure levelP(x) – proportion of population at each exposure levelP’(x) – counterfactual proportion of population at each exposure levelM – maximum exposure level.
20. Population Attributable FractionThe PAF requires two elements in its calculation:The prevalence of a risk factor in a defined population An estimate of the relative risk of the outcome in relation to the level of the exposure
21. (1) Estimating prevalence of each risk factor across the pooled SHeS cohort
22. (1) Estimating prevalence of each risk factor across the pooled SHeS cohort
23. (2) Estimating relative riskCohort study, used Cox-proportional hazards regression to examine the relationship between the time to stroke event and exposure to selected modifiable risk factorsComplicated by censoring and competing risksWe modelled the cause-specific hazardSystematic approach to adjustment for confounding
24. Directed Acyclic Graphs
25. Johannes Textor, Juliane Hardt, Sven Knüppel. DAGitty: A Graphical Tool for Analyzing Causal Diagrams.Epidemiology, 5(22):745, 2011.Accessed via: http://www.dagitty.net/
26. Theoretical Minimum Risk Level
27. Population Attributable Fractions and Disability Adjusted Life YearsAnother key metric of burden of disease studies is the DALYWe calculated the number of DALY’s attributable to each risk factor as the product of the DALY for stroke and the PAF for the respective risk factor
28. Stroke study results
29. How did our stroke results compare with GBD 2013?Risk factorPopulation Attributable Fraction estimatesSBoD 1995-2012GBD 2013High BMI19.2% (5.2 to 31.3)28.6 (24.0 to 33.6)High SBP31.3% (21.1 to 40.1)52.5% (45.1 to 59.9)High total cholesterol5.5% (2.6 to 11.0)Smoking25.6% (17.9 to 32.6)16.4% (11.6 to 21.5)Physical inactivity11.3% (7.7 to 15.1)Low fruit/vegetable consumption25.8% (20.3 to 31.7)/ 27.4% (17.0 to 37.8)Alcohol consumption7.4% (4.1 to 10.6)Area deprivation (SIMD)34.9% (26.4 to 42.4%)Area deprivation (Carstairs)23.5% (14.4 to 31.7)Education38.8% (26.0 to 49.4)Social class30.3 (19.4 to 39.8)
30.
31. StrengthsUses comprehensive routine datasets (SMR01 & NRS data) to create a large prospective study making causal inferences easierThe SHeS provides robust information on a range of behaviours and physiological risk factors associated with health outcomes as well as including socio-economic measuresLinked to administrative data on hospital admissions and deaths, providing a powerful resource for assessing the strength of causal relationships with strokeThe study has a transparent and replicable methodology Use of Directed Acyclic Graphs (DAGs) to illustrate the consistent approach taken to confounder adjustment in all analyses and the transparency of causal assumptionsThe study includes 95% confidence intervals around PAF and DALY estimates as a measure of the precision of estimatesAccounted for competing risks (important as ignoring competing risks can over-estimate the hazard ratios)
32. WeaknessesPotential for responder and recording bias (problems in measuring income, employment, self-assessed alcohol consumption, physical activity and diet). Self-reporting bias is likely to underestimate the hazard of stroke in terms of alcohol consumption.Pooling exposure data from 1995 to 2012 will mask any changes in the risk profile of the population over time.Limitations in the utility of using area deprivation measures for identifying risk at the individual level (ecological fallacy)The DAG approach forces you to be clear about the direction of causality e.g. alcohol consumption and deprivation.The small number of stroke events recorded in the SHeS-SMR/NRS linked dataset may have meant that some analyses were insufficiently powered to detect real differences for some of the risk factors.Unable to explore differing risk profiles for stroke subtypes
33. Scope of remaining workCalculating Population attributable fractions for a selected list of exposure-disease pairings as the data will reasonably allow.Publish PAFs for key risk factors:Socio-economic inequalityObesity*Alcohol SmokingCalculate attributable DALYs for all diseases combined Progression of causal mediation analysis element of studyHospitalisations attributable to overweight and obesity.*
34. Towards a robust, replicable methodologyValidating the process for generating PAFs (single, joint, particularly when allowing flexibility to model different scenarios other than the TMRL.)Practical tools (STATA? Excel?). How can we make these tools accessible and user-friendly?Considering pathways in PAF analysis What experiences have you had in calculating PAFs in your own work?Collaboration on CRA methods
35. Contact:Elaine TodPublic Health Information ManagerPublic Health ObservatoryNHS Health ScotlandEmail: elaine.tod@nhs.netTel: 0141 414 2751Thank you