
There are three different types of brain hemorrhages which includes epidural subdural and intraparenchymal hemorrhage We propose a machine learning based approach for a computeraided detection and diagnosis CAD system to detect the existence and type of hemorrhages in human brai ID: 1007299
Download Presentation The PPT/PDF document "C erebrovascular diseases or brain hemor..." is the property of its rightful owner. Permission is granted to download and print the materials on this web site for personal, non-commercial use only, and to display it on your personal computer provided you do not modify the materials and that you retain all copyright notices contained in the materials. By downloading content from our website, you accept the terms of this agreement.


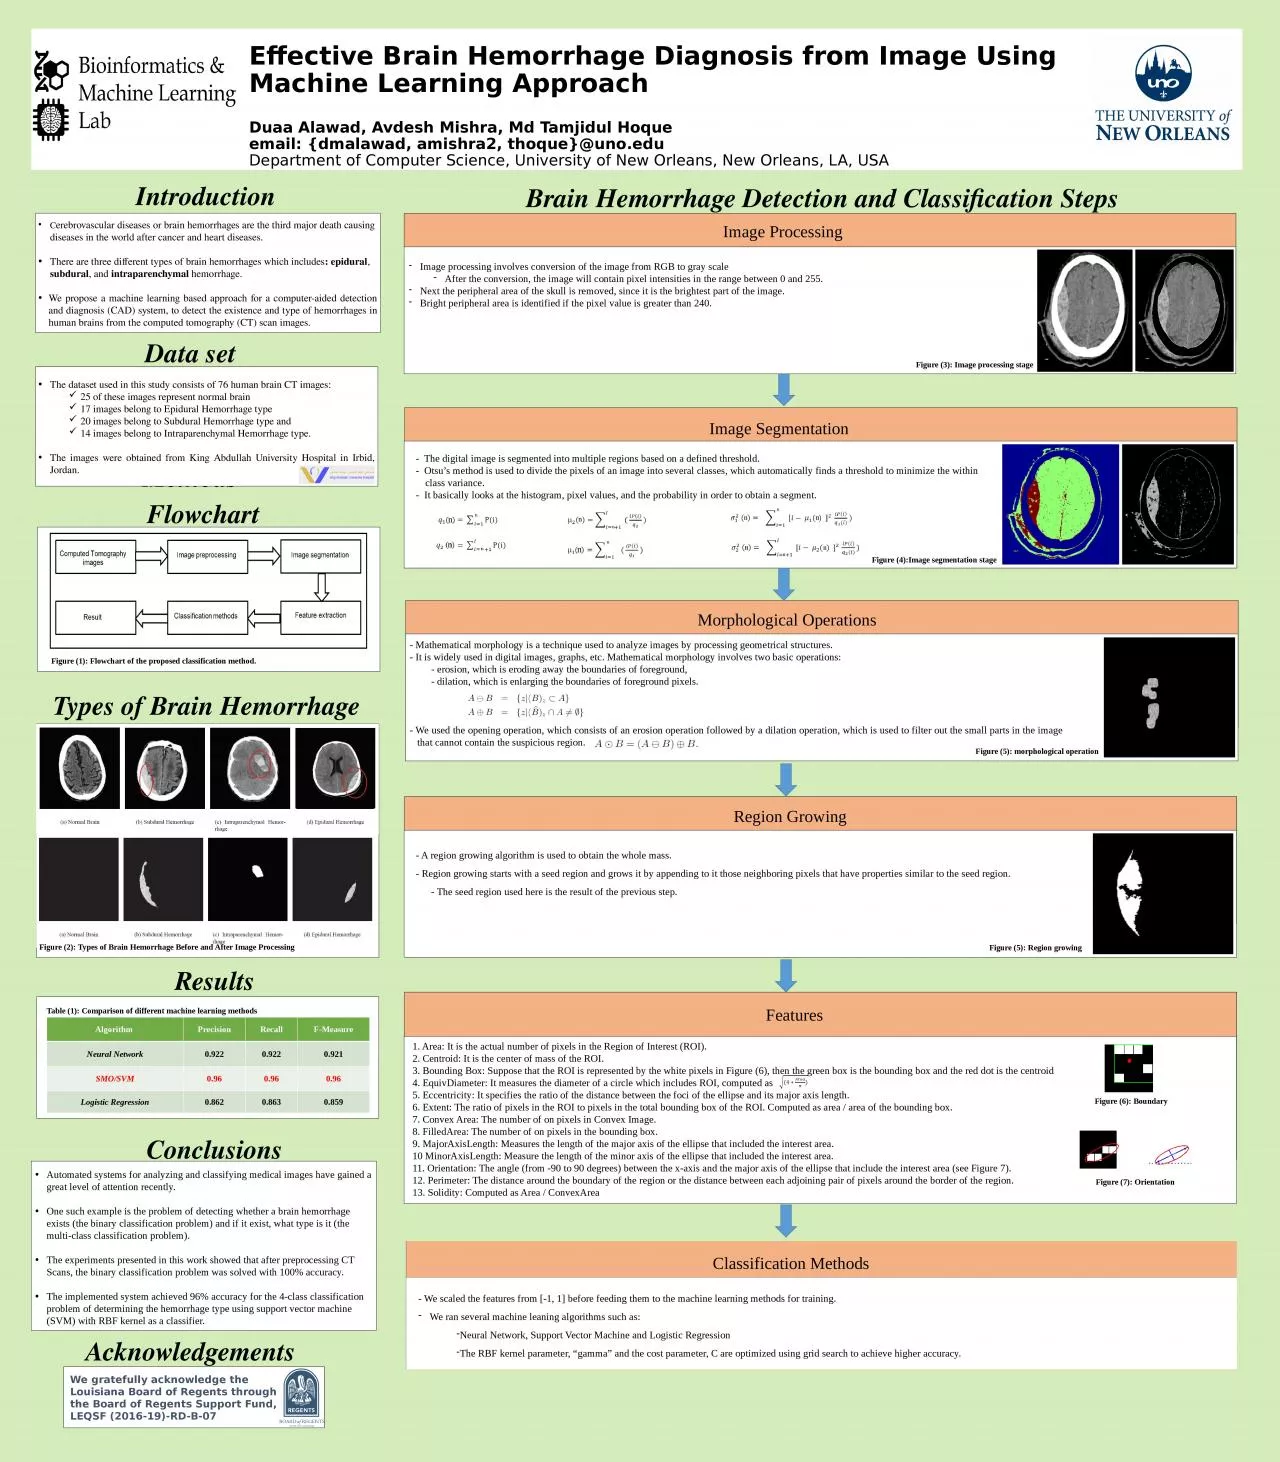
1. Cerebrovascular diseases or brain hemorrhages are the third major death causing diseases in the world after cancer and heart diseases.There are three different types of brain hemorrhages which includes: epidural, subdural, and intraparenchymal hemorrhage.We propose a machine learning based approach for a computer-aided detection and diagnosis (CAD) system, to detect the existence and type of hemorrhages in human brains from the computed tomography (CT) scan images.MethodsIntroductionAcknowledgementsWe gratefully acknowledge the Louisiana Board of Regents through the Board of Regents Support Fund, LEQSF (2016-19)-RD-B-07.FeaturesImage processing involves conversion of the image from RGB to gray scaleAfter the conversion, the image will contain pixel intensities in the range between 0 and 255. Next the peripheral area of the skull is removed, since it is the brightest part of the image.Bright peripheral area is identified if the pixel value is greater than 240. Image Processing - Mathematical morphology is a technique used to analyze images by processing geometrical structures.- It is widely used in digital images, graphs, etc. Mathematical morphology involves two basic operations: - erosion, which is eroding away the boundaries of foreground, - dilation, which is enlarging the boundaries of foreground pixels.- We used the opening operation, which consists of an erosion operation followed by a dilation operation, which is used to filter out the small parts in the image that cannot contain the suspicious region.- A region growing algorithm is used to obtain the whole mass. - Region growing starts with a seed region and grows it by appending to it those neighboring pixels that have properties similar to the seed region. - The seed region used here is the result of the previous step.1. Area: It is the actual number of pixels in the Region of Interest (ROI).2. Centroid: It is the center of mass of the ROI.3. Bounding Box: Suppose that the ROI is represented by the white pixels in Figure (6), then the green box is the bounding box and the red dot is the centroid 4. EquivDiameter: It measures the diameter of a circle which includes ROI, computed as 5. Eccentricity: It specifies the ratio of the distance between the foci of the ellipse and its major axis length. 6. Extent: The ratio of pixels in the ROI to pixels in the total bounding box of the ROI. Computed as area / area of the bounding box. 7. Convex Area: The number of on pixels in Convex Image.8. FilledArea: The number of on pixels in the bounding box.9. MajorAxisLength: Measures the length of the major axis of the ellipse that included the interest area.10 MinorAxisLength: Measure the length of the minor axis of the ellipse that included the interest area. 11. Orientation: The angle (from -90 to 90 degrees) between the x-axis and the major axis of the ellipse that include the interest area (see Figure 7).12. Perimeter: The distance around the boundary of the region or the distance between each adjoining pair of pixels around the border of the region.13. Solidity: Computed as Area / ConvexArea- The digital image is segmented into multiple regions based on a defined threshold.- Otsu’s method is used to divide the pixels of an image into several classes, which automatically finds a threshold to minimize the within class variance.- It basically looks at the histogram, pixel values, and the probability in order to obtain a segment.Image SegmentationMorphological OperationsRegion GrowingThe dataset used in this study consists of 76 human brain CT images: 25 of these images represent normal brain17 images belong to Epidural Hemorrhage type20 images belong to Subdural Hemorrhage type and14 images belong to Intraparenchymal Hemorrhage type. The images were obtained from King Abdullah University Hospital in Irbid, Jordan.Data setResultsFlowchart Types of Brain HemorrhageAlgorithm PrecisionRecallF-MeasureNeural Network0.9220.9220.921SMO/SVM0.960.960.96Logistic Regression0.8620.8630.859ConclusionsBrain Hemorrhage Detection and Classification Steps- We scaled the features from [-1, 1] before feeding them to the machine learning methods for training.We ran several machine leaning algorithms such as:Neural Network, Support Vector Machine and Logistic RegressionThe RBF kernel parameter, “gamma” and the cost parameter, C are optimized using grid search to achieve higher accuracy. Classification MethodsFigure (1): Flowchart of the proposed classification method.Figure (2): Types of Brain Hemorrhage Before and After Image ProcessingFigure (3): Image processing stageFigure (5): morphological operationFigure (4):Image segmentation stageFigure (5): Region growingFigure (6): BoundaryFigure (7): OrientationTable (1): Comparison of different machine learning methodsAutomated systems for analyzing and classifying medical images have gained a great level of attention recently.One such example is the problem of detecting whether a brain hemorrhage exists (the binary classification problem) and if it exist, what type is it (the multi-class classification problem). The experiments presented in this work showed that after preprocessing CT Scans, the binary classification problem was solved with 100% accuracy. The implemented system achieved 96% accuracy for the 4-class classification problem of determining the hemorrhage type using support vector machine (SVM) with RBF kernel as a classifier.Effective Brain Hemorrhage Diagnosis from Image Using Machine Learning ApproachDuaa Alawad, Avdesh Mishra, Md Tamjidul Hoqueemail: {dmalawad, amishra2, thoque}@uno.eduDepartment of Computer Science, University of New Orleans, New Orleans, LA, USA