
Greater Area Romania T Hriscan 12 S Burcea 2 G Iorga 3 1 University of Bucharest Faculty of Physics 2 National Meteorological Administration 3 University of Bucharest Dept of Physical ID: 1025304
Download Presentation The PPT/PDF document "Link between precipitations and air qual..." is the property of its rightful owner. Permission is granted to download and print the materials on this web site for personal, non-commercial use only, and to display it on your personal computer provided you do not modify the materials and that you retain all copyright notices contained in the materials. By downloading content from our website, you accept the terms of this agreement.


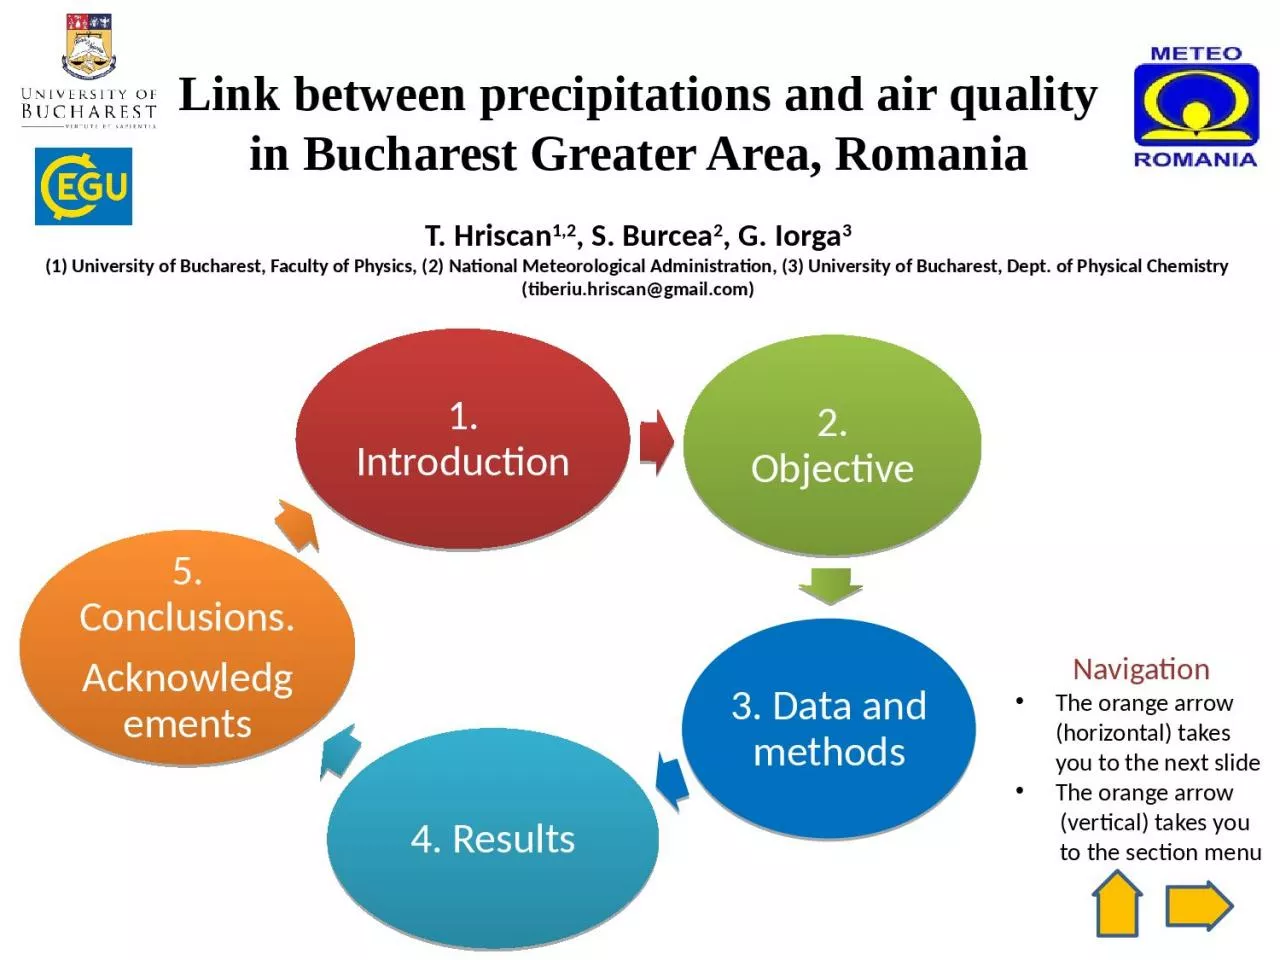
1. Link between precipitations and air quality in Bucharest Greater Area, RomaniaT. Hriscan1,2, S. Burcea2, G. Iorga3(1) University of Bucharest, Faculty of Physics, (2) National Meteorological Administration, (3) University of Bucharest, Dept. of Physical Chemistry (tiberiu.hriscan@gmail.com)1. Introduction2. Objective3. Data and methods4. Results5. Conclusions.AcknowledgementsNavigationThe orange arrow (horizontal) takes you to the next slideThe orange arrow (vertical) takes you to the section menu
2. Observation: lowest PM10 and PM2.5 in 2016 were correlated with intense precipitation eventsPercentilePM2.5 (µg m-3)PM10 (µg m-3)Minimum9.0910.9P2512.5422.17P50 (Median)15.8127.44P7520.7233.26Maximum47.7875.95Example: Bucharest and Prahova Region, 17-20.06.2016Introduction(Chiritescu, Hriscan et al., Geophys. Res. Abs. 21, 2019)
3. Main Pollution SourcesIndustrial –> electro-thermal power stations (CETs)Traffic – mixed vehicle fleet (non-EURO EURO6)Construction sitesResidential heating sourcesVarious points/areas where domestic waste is collected and storedPlenty of agricultural activities in the peri-urban areaLow ventilation coefficient(Manolache et al., 2019)IntroductionFig. 1 Map created using www.google.com/mapsBucharest Greater Area (44° 26’N, 26° 06’E)Located in open plain; surface of about 285 km2; altitudes: 56 m a.s.l. (SE) to 92 m a.s.l. (W); relatively round shape.
4. ObjectiveThis study examines how the concentrations of particulate matter with an aerodynamic diameter below 10 μm (PM10) and below 2.5 μm (PM2.5) might be linked with precipitation characteristics using an observational data set for three years (2015-2017) in Bucharest metropolitan area:Estimation of the scavenging coefficient of particulate matterLink of with rainfall category during the annual convective periods.Possible link between reduced air pollution and meteorological phenomena and the air mass history.
5. Surface dataPM10 and PM2.5 mass concentrationsLink precipitation-PM:Scavenging coefficientBucharest, DATABASEMultiple sources2015-2017In-situ meteorology(T, p, RH, WS, WD)Synoptic meteorologyBackward air mass trajectoriesRADAR dataImages, Reflectivity, EchotopsVariations of PM in connection precipitation typeConnection of phenomena with air mass historyData and methods
6. ResultsDaily mean PM10 and PM2.5 mass concentrations over Bucharest; 2015-2017PM2.5/PM10: 2016: 0.77 (R^2=0.73), Data Recovery : 35%2017: 0.63 (R^2=0.55), Data Recovery : 85%
7. ResultsPrecipitations by type during convective seasons 2015-2017RADAR Z-R relationship:Z = a Rb RADAR reflectivity Z (dBZ), Rain Rate (mm h-1), Stull (2000) classification
8. ResultsScavenging Coefficient: determination and comparisonsScavenging coefficient :C= particulate matter concentration (µg m-3); t=time (h-1) (h-1)ReferenceObservations3.36 x 10-5Webster and Thomson (2014)in-cloud8.4 x 10-5Webster and Thomson (2014below cloud2.3 x 10-6 – 8.4 x 10⁻⁵Zikova and Zdimal (2016)10-800 nm1.1 x 10-5 – 7.6 x 10⁻⁴Chate and Pranesha (2004)13-750 nm5.9 x 10-6 –1.4 x 10⁻⁵Maria and Russell (2005)10-20000 nm6.2 x 10-5 – 3.0 x 10⁻⁴Depuydt et al. (2013)250-32000 nm3.29 x 10-3 – 4.71 x 10⁻³Hriscan et al. (2019)long, intense (7-8 consecutive days)Examples from this study, focus on long (>24 h-1) precipitations8.50 x 10-4intense / heavy (30 h, July 2017)3.19 x 10⁻³light / moderate (26 h, May 2017)
9. Connection of meteorological phenomena occurrence and air mass historyResultsExamples of typical air mass back trajectories201520162017
10. We observed PM10 levels exceeded frequently the daily limit value of 50 µg m-3 imposed by the EU legislation; even peaks of about 2.5 times higher were observed. Both PM10 and PM2.5 presented higher values during the wintertime and generally higher values in 2015 and 2016 than in 2017. A larger fraction of coarse particles was present in 2017.Assessment of mean scavenging coefficient for Bucharest Greater area has been performed for the first time.Type of precipitation has a strong influence on the atmospheric aerosol concentrations: intense and heavy precipitation determined an increased value of scavenging coefficient with up to one order of magnitude higher than in case of a moderate precipitation.Present results a good capability of the convective precipitating systems to clear from aerosol the atmosphere over Bucharest Greater Area. The obtained results are important for modeling of air quality and for investigations of aerosol wet deposition processes.Conclusions
11. The authors thank the financial support from UB198/Int project and to National Meteorological Administration for access to the RADAR database. The data regarding ground-based air pollution and meteorology by site was extracted from the public available Romanian National Air Quality Database, www.calitateaer.ro , last accessed in December 2019. NOAA Air Resources Laboratory for HYSPLIT transport and dispersion model and READY website (www.arl.noaa.gov/ready.php) is gratefully acknowledged.Thank you! Acknowledgements