
Sometimes it is convenient to have one number that describes a set of data This number is called a measure of central tendency because it represents the center or middle of the data The most commonly used measures of central tendency are the ID: 1018842
Download Presentation The PPT/PDF document "Statistical Measures Measures of Central..." is the property of its rightful owner. Permission is granted to download and print the materials on this web site for personal, non-commercial use only, and to display it on your personal computer provided you do not modify the materials and that you retain all copyright notices contained in the materials. By downloading content from our website, you accept the terms of this agreement.


1. Statistical Measures
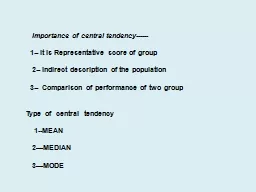
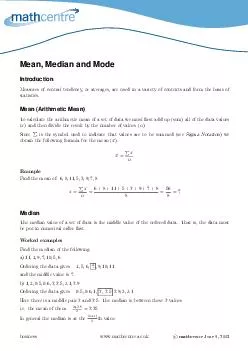
2. Measures of Central TendencySometimes it is convenient to have one number that describes a set of data. This number is called a measure of central tendency, because it represents the center or middle of the data. The most commonly used measures of central tendency are the mean, median, and mode.
3. Mean, Median, or ModeREVIEW:What is the mean?The average of the data.What is the median?The middle of the data.What is the mode? The number that appears most often in the data.
4. Measures of TendencyUseWhenMeanThe data are spread out, and you want an average of the values.MedianThe data contain outliers.ModeThe data are tightly clustered around one or two values.
5. OutlierAn outlier is an extreme value that is much less than or much greater than the other data values. Outliers have a strong effect on the mean and standard deviation. One way to determine an outlier is by considering data that is more than 3 standard deviations from the mean.
6. Ex. 1 A sweepstakes offers a first prize of $10,000, two second prizes of $100, and one hundred third prizes of $10.Which measure of central tendency best represents the available prizes?Since 100 of 103 prizes are $10, the mode ($10) best represents the available prizes. Notice that in this case the median is the same as the mode.
7. SweepstakesWhich measure of central tendency would the organizers of the sweepstakes be most likely to use in their advertising?The organizers would be most likely to use the mean (about $109) to make people think they had a better chance of winning more money.
8. Measures of Variation or dispersion measure how spread out or scattered a set of data is.Variance and standard deviation are measures of variation that indicate how much the data values differ from the mean.You could use the range or the interquartile range.
9. Finding the variance
10. Find the Standard DeviationFind the standard deviation, σ, by taking the square root of the variance.
11. Example 2The data represent the number of milligrams of a substance in a patient’s blood, found on consecutive doctor visits. Find the mean, the variance, and the standard deviation of the data.{14, 13, 16, 9, 3, 7, 11, 12, 11, 4}The mean is 10.The variance is 16.2.The standard deviation is 4.02
12. Standard Deviations from the meanMost of the members of a set of data are within 1 standard deviation of the mean. -2.06 1.96 5.98 10 14.02 18.04 22.061 Std. Dev.2 Standard Dev.3 Standard Deviations from the mean
13. HomeworkPage 667-669: 21-36
14. Standard Deviation on the Calculator Sx is the Standard Deviation for a sampling of the population.σx is the standard deviation for the whole population.
15. Normal DistributionThe normal distribution is represented by a curve that looks like a bell. It is symmetrical and often called the bell curve. Many distributions with symmetric curves or histograms are normal distributions.
16. Skewed DistributionA curve or histogram that is not symmetric represents a skewed distribution.Positively skewed – is high at the left and has a tail to the rightNegatively skewed – is high at the right and has a tail to the left.
17. Use of Normal DistributionsNormal distributions occur quite frequently in real life. Standardized test scores, the lengths of newborn babies, the useful life and size of manufactured items, and production levels can all be represented by normal distributions. In all of these cases, the number of data values must be large for the distribution to be approximately normal.
18. Properties of Normal DistributionThe graph is maximized at the mean. The mean, median, and mode are about equal.About 68% of the values are within one standard deviation of the mean.About 95% of the values are within two standard deviations of the mean.About 99.7% of the values are within three standard deviations of the mean.
19. One standard deviation away from the mean ( ) in either direction on the horizontal axis accounts for around 68 percent of the data. Two standard deviations away from the mean accounts for roughly 95 percent of the data with three standard deviations representing about 99.7 percent of the data.
20. What is a Z-score?The Z-score is the number of standard deviations a number is removed from the mean. Mean + Z-score(Std. Dev.) = # of Std. Dev. from the mean
21. Example 1Example: 95% of students at school are between 1.1m and 1.7m tall.Assuming this data is normally distributed can you calculate the mean and standard deviation?
22. Example 2The reaction times for a hand-eye coordination test administered to 1800 teenagers are normally distributed with a mean of 0.35 second and a standard deviation of .05 second.About how many teens had reaction times between .25 and .45 second?About how many teens had reaction times between .25 and .35 second?
23. Example 3Students counted the number of candies in 100 small packages. They found that the number of candies per package was normally distributed, with a mean of 23 candies per package and a standard deviation of 1 piece of candy.About how many packages had between 24 and 22 candies?What is the probability that a package selected at random had more than 25 candies?
24. HomeworkPage 673-675: 4-26
25. How do I graph the normal curve?On the calculatorY = 2nd VARS #1 Enter x, mean, Standard Deviation.Should look like y = normalpdf(x, mean, Standard Deviation)
26. More on graphing the normal curveYou will need to set the windowYour domain should make sense from the mean and the standard deviationLet your range min be -0.1 and your max be 0.1 (for starters)Look at the curve and adjust the window as needed.
27. How do I find the probability that a value selected lies between two values.On the calculator after graphing the normal curve.2nd Vars ,over to Draw,#1 enter, first number, second number, mean, standard deviation.Change the decimal to a percent
28. How do I find the probability that a value selected lies between two values? On the calculator choose 2nd varsChoose #2 normalcdf(Type the lower number, the upper number, the mean, then the standard deviationIf we need to, our smallest number is and our largest number is (Looks like 1E99 on calculator.)
29. Normal Distribution ProbabilityA Calculus exam is given to 500 students. The scores have a normal distribution with a mean of 78 and a standard deviation of 5. What percent of the students have scores between 82 and 90?Example:TI 83/84 directions: Press [2nd][VARS](DISTR) [2] (normalcdf) b. Press [82] [,] [90] [,] [78] [,] [5] [)][Enter]normalcdf(82,90,78,5) .2036578048There is a 20.37% probability that a student scored between 82 and 90 on the Calculus exam.TI 83/84
30. Normal Distribution ProbabilityFind the probability of scoring below a 1400 on the SAT if the scores are normal distributed with a mean of 1500 and a standard deviation of 200.Practice:Answer Now