
Konstantin Alexeev Haodong Zhou BSc Guy Trudel MD Odette Laneuville PhD Department of Biology Faculty of Science and Bone and Joint Research Laboratory Faculty of Medicine ID: 1033251
Download Presentation The PPT/PDF document "Investigating reversibility of marrow ad..." is the property of its rightful owner. Permission is granted to download and print the materials on this web site for personal, non-commercial use only, and to display it on your personal computer provided you do not modify the materials and that you retain all copyright notices contained in the materials. By downloading content from our website, you accept the terms of this agreement.


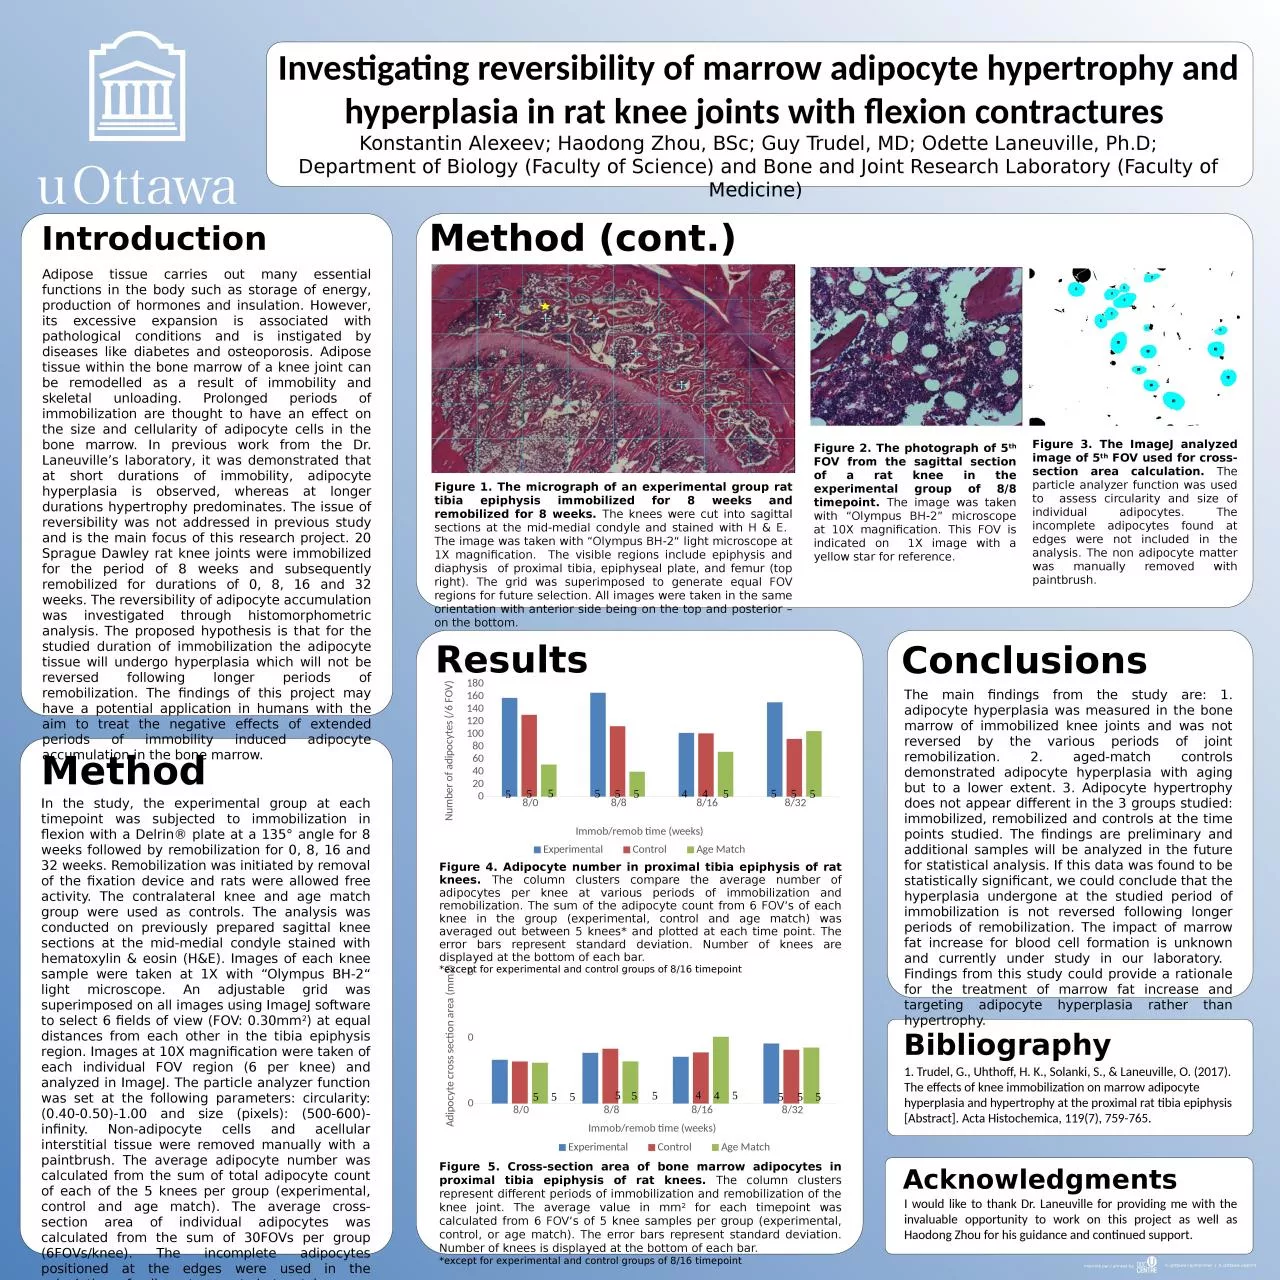
1. Investigating reversibility of marrow adipocyte hypertrophy and hyperplasia in rat knee joints with flexion contractures Konstantin Alexeev; Haodong Zhou, BSc; Guy Trudel, MD; Odette Laneuville, Ph.D;Department of Biology (Faculty of Science) and Bone and Joint Research Laboratory (Faculty of Medicine) IntroductionMethod (cont.)ConclusionsBibliographyResultsAcknowledgmentsFigure 5. Cross-section area of bone marrow adipocytes in proximal tibia epiphysis of rat knees. The column clusters represent different periods of immobilization and remobilization of the knee joint. The average value in mm2 for each timepoint was calculated from 6 FOV’s of 5 knee samples per group (experimental, control, or age match). The error bars represent standard deviation. Number of knees is displayed at the bottom of each bar.*except for experimental and control groups of 8/16 timepoint Adipose tissue carries out many essential functions in the body such as storage of energy, production of hormones and insulation. However, its excessive expansion is associated with pathological conditions and is instigated by diseases like diabetes and osteoporosis. Adipose tissue within the bone marrow of a knee joint can be remodelled as a result of immobility and skeletal unloading. Prolonged periods of immobilization are thought to have an effect on the size and cellularity of adipocyte cells in the bone marrow. In previous work from the Dr. Laneuville’s laboratory, it was demonstrated that at short durations of immobility, adipocyte hyperplasia is observed, whereas at longer durations hypertrophy predominates. The issue of reversibility was not addressed in previous study and is the main focus of this research project. 20 Sprague Dawley rat knee joints were immobilized for the period of 8 weeks and subsequently remobilized for durations of 0, 8, 16 and 32 weeks. The reversibility of adipocyte accumulation was investigated through histomorphometric analysis. The proposed hypothesis is that for the studied duration of immobilization the adipocyte tissue will undergo hyperplasia which will not be reversed following longer periods of remobilization. The findings of this project may have a potential application in humans with the aim to treat the negative effects of extended periods of immobility induced adipocyte accumulation in the bone marrow. Figure 1. The micrograph of an experimental group rat tibia epiphysis immobilized for 8 weeks and remobilized for 8 weeks. The knees were cut into sagittal sections at the mid-medial condyle and stained with H & E. The image was taken with “Olympus BH-2“ light microscope at 1X magnification. The visible regions include epiphysis and diaphysis of proximal tibia, epiphyseal plate, and femur (top right). The grid was superimposed to generate equal FOV regions for future selection. All images were taken in the same orientation with anterior side being on the top and posterior – on the bottom. Figure 2. The photograph of 5th FOV from the sagittal section of a rat knee in the experimental group of 8/8 timepoint. The image was taken with “Olympus BH-2” microscope at 10X magnification. This FOV is indicated on 1X image with a yellow star for reference. 1. Trudel, G., Uhthoff, H. K., Solanki, S., & Laneuville, O. (2017). The effects of knee immobilization on marrow adipocyte hyperplasia and hypertrophy at the proximal rat tibia epiphysis [Abstract]. Acta Histochemica, 119(7), 759-765. MethodI would like to thank Dr. Laneuville for providing me with the invaluable opportunity to work on this project as well as Haodong Zhou for his guidance and continued support. Figure 4. Adipocyte number in proximal tibia epiphysis of rat knees. The column clusters compare the average number of adipocytes per knee at various periods of immobilization and remobilization. The sum of the adipocyte count from 6 FOV’s of each knee in the group (experimental, control and age match) was averaged out between 5 knees* and plotted at each time point. The error bars represent standard deviation. Number of knees are displayed at the bottom of each bar.*except for experimental and control groups of 8/16 timepoint Figure 3. The ImageJ analyzed image of 5th FOV used for cross-section area calculation. The particle analyzer function was used to assess circularity and size of individual adipocytes. The incomplete adipocytes found at edges were not included in the analysis. The non adipocyte matter was manually removed with paintbrush. The main findings from the study are: 1. adipocyte hyperplasia was measured in the bone marrow of immobilized knee joints and was not reversed by the various periods of joint remobilization. 2. aged-match controls demonstrated adipocyte hyperplasia with aging but to a lower extent. 3. Adipocyte hypertrophy does not appear different in the 3 groups studied: immobilized, remobilized and controls at the time points studied. The findings are preliminary and additional samples will be analyzed in the future for statistical analysis. If this data was found to be statistically significant, we could conclude that the hyperplasia undergone at the studied period of immobilization is not reversed following longer periods of remobilization. The impact of marrow fat increase for blood cell formation is unknown and currently under study in our laboratory. Findings from this study could provide a rationale for the treatment of marrow fat increase and targeting adipocyte hyperplasia rather than hypertrophy.In the study, the experimental group at each timepoint was subjected to immobilization in flexion with a Delrin® plate at a 135° angle for 8 weeks followed by remobilization for 0, 8, 16 and 32 weeks. Remobilization was initiated by removal of the fixation device and rats were allowed free activity. The contralateral knee and age match group were used as controls. The analysis was conducted on previously prepared sagittal knee sections at the mid-medial condyle stained with hematoxylin & eosin (H&E). Images of each knee sample were taken at 1X with “Olympus BH-2“ light microscope. An adjustable grid was superimposed on all images using ImageJ software to select 6 fields of view (FOV: 0.30mm2) at equal distances from each other in the tibia epiphysis region. Images at 10X magnification were taken of each individual FOV region (6 per knee) and analyzed in ImageJ. The particle analyzer function was set at the following parameters: circularity: (0.40-0.50)-1.00 and size (pixels): (500-600)-infinity. Non-adipocyte cells and acellular interstitial tissue were removed manually with a paintbrush. The average adipocyte number was calculated from the sum of total adipocyte count of each of the 5 knees per group (experimental, control and age match). The average cross-section area of individual adipocytes was calculated from the sum of 30FOVs per group (6FOVs/knee). The incomplete adipocytes positioned at the edges were used in the calculation of adipocyte count, but not in cross-section area. All data were input into excel sheet.