
Geophysical Case HistoriesPaper 92 In Proceedings of Exploration 07 Fifth Decennial International Conference on Mineral Exploration edited by B Milkereit 2007 p 10431047Figure 2 Bouguer gravity anoma ID: 874522
Download Pdf The PPT/PDF document "Key R 1 British Geological Survey E..." is the property of its rightful owner. Permission is granted to download and print the materials on this web site for personal, non-commercial use only, and to display it on your personal computer provided you do not modify the materials and that you retain all copyright notices contained in the materials. By downloading content from our website, you accept the terms of this agreement.


1 . , Key, R. ] _______________________![. , Key, R. ] _______________________](874522/key-r-1-british-geological-survey-edinbu.jpg ". , Key, R. ] _______________________")
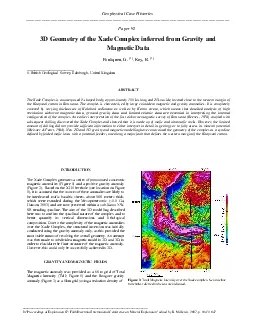
. , Key, R. ] _________________________ 1. British Geological Survey, Edinburgh, United Kingdom Geophysical Case Histories_________________________________________________________________________________________Paper 92 ___________________________________________________________________________In "Proceedings of Exploration 07: Fifth Decennial International Conference on Mineral Exploration" edited by B. Milkereit, 2007, p. 1043-1047 Figure 2. Bouguer gravity anomaly (Left; mGa l). The contours of the anomaly are displayed only in the area used for the inversion. 2.67 gcm - 3). The resolution of the gravity field is limited by the data distribution and the accuracy with which station elevations were measured (Reeves & Hutchins, 19 76). The complex is characterized by a gravity high which approximately mirrors the shape of the structural syncline. The Bouguer anomaly reaches a maximum value of almost 30 mGal (after removal of a regional trend) in the northern part of the complex (see Figure 2). To the west, this complex is bordered by a north - south elongated negative anomaly that defines the edge of the Kaapvaal craton. The magnetic anomaly envelope coincides with the gravity anomaly but exhibits a more complex pattern characterized by series of short wavelength concentric anomalies. These anomalies are likely to reflect magnetic contrasts between successive volcanic units. The magnetic anomalies are characterized by high amplitudes (700 nT to 850 nT), with a broad positive feature to the northeast and a narrower positive stripe close to the southwestern margin. BOREHOLE DATA Only 2 boreholes have been drilled to intersect this body. Borehole XH1 penetrated through Kalahari sediments and sub horizontal Karoo strata before intersecti ng lavas at 621m (Table 1). Shales assigned to the Palaeoproterozoic Waterberg Group were intersected at 1351 m to indicate a total lava thickness of 730 m (Table 1). Borehole, CKP - 6A, drilled on the western edge of the Xade Complex, intersected dolerite at 419m. Physical property measurements on samples from this borehole indicat
2 e that the lavas have a magnetic suscept
e that the lavas have a magnetic susceptibility of 0.1 - 0.45 SI, a remanent intensity of 0.6 up to 64 A/m and densities of 2.7 gcm - 3 - 3.0 gcm - 3. Table 1: XH1 borehole summary log. (Borehole located at 23º 46’ 29” E 23º 06’ 00” S). The Ecca and Dwyka formations are part of the Karoo Supergroup. Depth (m) Lithology 0 - 119 Kalahari beds 119 - 470 Ecca Group strata 470 - 555 Mafic sheet 555 - 580 Ecca Group strata 580 - 621 Dwyka Grou p glacigenic strata 621 - 1140 Mafic lavas (Xade complex) 1140 - 1351 Mafic sheet (Xade complex) 1351 - 1741 Waterberg Group shales In addition, the CKP6 and CKP6A boreholes also intersected gabbro and dolerite sheets within the complex that have similarly high magnetic susceptibility (0.03 - 0.4 SI). However, it is inferred from the modelling and analysis presented here that the extrusive units are the main source of the gravity and magnetic anomalies. 2D MODELLING A SEGY file has been provided of the N - S seismic line KG - 01 which crosses the south - eastern part of the Xade Complex (Figure 1). The seismic section has been depth converted using a logarithmic function between average velocity and two - way time based upon a two - layer model of 3 km/s down to 400ms and 5 km/s at later times than this. A 2D model of the subsurface has then been constructed (Figure 3). The starting model had four horizons: a digital terrain model, the base of the Kalahari beds, the base of the Karoo Group and the base of the Xade Comp lex derived from 3D modelling (using a density contrast of +0.2 gcm - 3 see further discussion below). A good match between the observed and calculated Bouguer anomalies is obtained using a single density contrast between the complex and the host rocks (+0.2 gcm - 3 based on density measurements from core). No attempt has been made to modify the shape of the complex as the geometry based on 3D modelling provides a very good fit with the observed Bouguer anomaly. In order to match the fine structures of the magn etic anomaly we have subdivided the syncline and i
3 ntroduced susceptibility variations (Fi
ntroduced susceptibility variations (Figure 3; susceptibilities range from 0.16 SI to 0.06 SI). Only the complex was assigned any magnetization, and it was assumed that this was in the direction of the Ear th’s present field. The highest magnetic susceptibility is located within the upper layers within the complex and decreases to 0.01 SI in the lowest layer. 1044_________________________________________________________________________________________ Figure 3: 2D gravity and magnetic modelling across the Xade complex (along line KG - 01). 3D MO DELLING A 3D model of the subsurface was constructed which had three layers: a digital terrain model, the base of the Karoo Group and the base of the Xade Complex. The base Karoo was fixed at 600 meters below the ground surface (500 m above datum), and t he base of the complex was initially defined as a flat surface lying at the same depth. The base of the Karoo Supergroup defines a clipping surface for the syncline (i.e. it was not allowed to extend above this level). Apart from the Xade Complex itself, a uniform density was applied to all pre - Karoo rocks, although it is recognized that this may be an oversimplification (although the surrounding rocks are dominated by siliciclastic Waterberg sediments that will have a uniform density). Alternative models were generated in which the complex was assigned a density contrast of 0.1 gcm - 3, 0.2 gcm - 3 and 0.3 gcm - 3. Only the complex was assigned any magnetization, and it was assumed that this was in the direction of the Earth’s present field. Once the initial m odel had been built, we ran a structural inversion of the Bouguer anomaly (using a 5 km low - pass filtered anomaly as an input) that only allowed the base of the complex to be modified. The following workflow was applied: 1. The input grids were resampled to 200 meters and a regional gravity field (linear trend) was removed. 2. The Bouguer anomaly was computed and the residual anomaly inverted to define a new top surface for the complex. 3 . The total magnetic intensity was computed us
4 ing the new model, to see if the gravi
ing the new model, to see if the gravity interpretation was consistent with the magnetic data. 4 . Further trials were conducted to investigate whether the introduction of magnetic susceptibility variations within the complex (subdividing the syncline into a series of interleave d magnetized layers) improved the match between the observed and calculated magnetic anomalies. RESULTS The models produce a comparable misfit between the observed and predicted gravity anomalies (Table 2). The surfaces of the syncline base calculated us ing the three density contrasts: +0.1 gcm - 3 ,+0.2 gcm - 3 and +0.3 gcm - 3 are illustrated in F igures 4 and 5. The main mismatch occurs in the eastern part, where the north - south trending gravity low is not properly recovered and errors over the complex itself were smaller that the overall misfit statistics suggest. Table 2: Gravity inversion results summary (gravity misfit, predicted depth and thickness of the complex). We used these models to forward compute the magnetic anomaly generated by the complex a ssuming that it had a uniform, averaged magnetic susceptibility of 0.075 SI units. The longer wavelength components of the observed magnetic anomaly are well reproduced, considering the simplicity of the model. The anomaly amplitudes are underestimated, bu t the property measurements from samples in XH1 provide scope for incorporating higher values. The calculated field lacks the short wavelength concentric magnetic anomaly pattern in the observed field, which the 2D modelling (Figure 3) has suggested is due to magnetic property variations within the complex. An attempt was made to divide the complex into differently magnetized layers in 3D but this proved difficult and the initial results do not represent a significant advance on the single layer model. Geo metry of the Xade complex (comparison with seismic Line KG - 01) Although the three models produce a similar synclinal shape, they predict very different thicknesses (Table 2), from a 2.3 km thick body with the highest density contrast (0.3 gcm - 3) to a 10 k m thick body wi
5 th the lowest density contrast. We supe
th the lowest density contrast. We superimposed cross - sections through the three models on the reflection seismic section for profile KG - 01 to see if this would provide additional control (Figure 4). Model Density ( gcm - 3) Model 1 ( ñ=0.1) Model 2 ( ñ=0.2) Model 3 ( ñ=0.3) Misfit after inversion (standard deviation) 5.4 mGal 5.0 mGal 4.9 mGal Xade complex max depth below datum 10000 m 4000 m 2270 m Xade complex max thickness 10500 m 4500 m 2800 m 1045Pouliquen, G., and Key, R. 3D geometry of the Xade Complex inferred from Gravity and Magnetic Data __________________________________________________________________________________________ Figure 4: Syncline shape from Bouguer anomaly structural inversion (in yellow). Increasing depths are obtained for decreasing density contrast (respectively for 0.3, 0.2 and 0.1 gcm-3 from top to bottom). The TMI and Bouguer anomaly (inverted in the figure) have been overlaid in red. Top right corner: location plot of the KG-01 section below the magnetic anomaly. The results of the modelling and comparison with the observed magnetic anomaly pattern demonstrate that the complex does not itself have a distinct seismic signature, but that the overall form of the syncline is defined by reflections from underlying sedimentary units. It is likely that scattering and attenuation of seismic energy in the thickest part of the igneous sequence has prevented the imaging of underlying strata in the axial region. Despite this, it is possible to identify the most appropriate density contrast on the basis of the match between the modelled flanks of the complex and the seismic imaging of underlying structure. This comparison suggests that a contrast of between +0.2 gcm-3 and +0.3 gcm-3 is most appropriate (Figure 5). Results of inversions suggest a depth extent of approximately 3 kms for the complex. Figure 5: Depth of the Xade complex below datum (in km, positive down) using a density contrast of + 0.2 gcm-3 for the gravity inversion.). The top of the complex lies at 500 m above datum. 1046 Geophysical Case Histo