
1 for the Third Quarter of 2018 BEIJING CHINA December 5 201 8 Momo Inc NASDAQ MOMO Momo or the Company a leading mobile social networking platform in China today announced its ID: 838528
Download Pdf The PPT/PDF document "Momo Announces Unaudited Financial Resul..." is the property of its rightful owner. Permission is granted to download and print the materials on this web site for personal, non-commercial use only, and to display it on your personal computer provided you do not modify the materials and that you retain all copyright notices contained in the materials. By downloading content from our website, you accept the terms of this agreement.


1 1 Momo Announces Unaudited Financial R
1 Momo Announces Unaudited Financial Results for the Third Quarter of 2018 BEIJING, CHINA, December 5 , 201 8 – Momo Inc. (NASDAQ: MOMO) ("Momo" or the "Company"), a leading mobile social networking platform in China, today announced its unaudited financial results for the third quarter of 201 8 . Third Quarter of 201 8 Highlights • Net revenues increase d 5 1 % year over year to $ 53 6.0 million in the third quarter of 2018 . • Net income attributable to Momo Inc. increased to $ 8 5.2 million in the third quarter of 201 8 from $ 79.1 million in the same period last year. • Non - GAAP net income attributable to Momo Inc. (n ote 1) increased 2 2 % to $ 1 1 4.3 millio n in the third quarter of 201 8 from $ 93.8 m illion in the same period last year. • Diluted net income per American Depositary Share ( “ ADS ” ) was $ 0. 39 , compared to $0. 38 in the same period last year. • Non - GAAP diluted net income per ADS (note 1) was $ 0. 5 3 , co mpared to $0.4 5 in the same period last year. • Monthly Active Users ("MAU") on Momo application were 110.5 million in September 201 8 , compared to 94.4 million in September 201 7 . • Total paying users of our live video service and value - added service, without double counting the overlap , including 3.6 million paying users of Tantan Limited ("Tantan") , were 12. 5 million for the third quarter of 2018, compared to 7. 3 million for the third quarter of 2017. First Nine Months of 201 8 H ighlights Net revenues increased 5 7 % year over year to $ 1, 465.4 million for the first nine months of 201 8 . Net income attribut able to Momo Inc. was $ 3 32.8 million for the first nine months of 201 8 , compared with $ 221.1 m illion during the same period of 201 7 . Non - GAAP net income attributable to Momo Inc. (note 1) was $ 3 96.7 million for the first nine months of 201 8 , compared with $ 258.2 m illion during the same period of 201 7 . Diluted net income per ADS was $ 1. 57 for the first nine months of 201 8 , compared with $ 1.07 during the same period of 201 7 . Non - GAAP diluted income per ADS (note 1) was $ 1. 87 for the first nine months of 201 8 , compared with $ 1.24 during the same period of 201 7 . “ I am pleased that we delivered solid operational and financial results for the quarter. ” Commented Yan Tang, Chairman and CEO of Momo. “ At the same time we continued to push forward on product and operational fronts, in order to build up lon
2 ger term growth dri vers as we start to
ger term growth dri vers as we start to look beyond 2018 into next year. ” Third Quarter of 201 8 Financial Results Net revenues Total net revenues were $ 53 6.0 million in the third quarter of 201 8 , an increase of 5 1 % from $ 354.5 m illion in the third quarter of 201 7 . 2 L ive video service revenues were $ 40 6.9 million in t he third quarter of 2018 , an increase of 34 % from $ 302.6 million during the same period of 201 7 . The growth in live video revenue s was contributed by the increase in the quarterly paying users , as well as the increase in the average revenues per paying user per quarter . Value - added service revenues mainly include membership subscription revenues and virtual gift revenues. The total value - added service revenues were $ 8 4.2 million in t he third quarter of 2018 , an increase of 22 1 % from $ 26.3 million during the same period of 201 7 . The year over year increase was primarily attributable to the continuous growth of the virtual gift business on the Momo application and to a lesser extent, the consoli dation of Tantan ’ s membership subscription revenues for the whole third quarter of 2018 . The growth of the virtual gift business was driven by more paying use cases introduced to enhance the social experience for Momo users. Mobile marketing revenues were $17. 2 million in the third quarter of 2018 , a de crease of 1% from $17.4 million during the same period of 2017. Mobile games revenues were $ 4. 1 million in the third quarter of 2018 , a decrease of 4 9 % from $ 8.0 million in the third quarter of 2017 . The decrease in game revenues was mainly due to the decrease in qu arterly paying users . Revenues from other services in t he third quarter of 2018 mainly consisted of revenues from Phanta City, a TV variety show co - produced by the Company. Cost and expenses Cost and expenses were $ 4 42.1 million in t he third quarter of 2018 , an increase of 6 6 % from $ 266.3 million in t he third quarter of 2017 . The increase was primarily attributable to: ( a ) an increase in revenue sharing with the broadcasters related to our live video service and virtual gift recipients ; (b) the produced content s in connection with Phanta City ; ( c ) an increase in personnel related costs including share - based compensation expenses as a result of the Company ’ s rapidly expanding talent pool ; ( d ) an increase in marketing and promotional expenses to enhance our brand awareness and attract users ; and (e) an increase in a mortization expenses related to the intangible as
3 sets from acquisitions . Non - GAAP c
sets from acquisitions . Non - GAAP cost and expenses (note 1) were $ 4 11.7 million in t he third quarter of 2018 , an increase of 6 4 % from $ 251.7 million during the same period last year. Income from operations Income from operations was $ 9 4.6 million in t he third quarter of 2018 , compared to $ 89.0 m illion during the same period last year. Non - GAAP income from operations (note 1) was $ 12 5.1 million in t he third quarter of 2018 , compared to $ 103.7 m illion during the same period last year. Income tax expenses Income tax expenses were $ 2 1.6 million in t he third quarter of 2018 , increased from $17.2 m illion in t he third quarter of 2017 . The increase was mainly because we generated higher profit in t he third quarter of 2018 . 3 Net income attributable to Momo Inc. Net income attributable to Momo Inc. was $ 8 5.2 million in t he third quarter of 2018 , compared to $ 79.1 m illion during the same period last year. Non - GAAP net income (note 1) attributable to Momo Inc. was $ 11 4.3 million in t he third quarter of 2018 , compared to $ 93.8 m illion during the same period last year. Net income per ADS Dilute d net income per ADS was $ 0. 39 in t he third quarter of 2018 , compared to $ 0.38 in t he third quarter of 2017 . Non - GAAP diluted net income per ADS (note 1) was $ 0. 5 3 in t he third quarter of 2018 , compared to $ 0.45 in t he third quarter of 2017 . Cash and cash flow As of September 30 , 201 8 , Momo ’ s cash, cash equivalents , term deposits , r estricted cash and s hort - term investment totaled $ 1 , 493 . 6 m illion , compared to $ 1, 0 61 . 2 million as of December 31, 201 7 . Net cash provided by operating activities in the third quarter of 201 8 was $ 50.9 million , compared to $ 104.6 m illion for the same quarter of 201 7 . The decrease in the operating cash flow for the quarter was primarily because revenues from the TV show P hanta C ity still sit as accounts receivable on the balance sheet while related costs have largely been paid. F irst Nine Months of 201 8 Financial Results Net revenues for the first nine months of 201 8 were $ 1, 465.4 million, an increase of 5 7 % from $ 931.9 m illion in the same period of 201 7 , primarily drive n by the significant increase in net revenues from live video service and value - added service . Net income attributable to Momo Inc. was $ 3 32.8 million in the first nine months of 201 8 , compared to $ 221.1 m illion during the same period of 201 7 . Non -
4 GAAP net income attributable to Momo Inc
GAAP net income attributable to Momo Inc. (note 1) was $ 3 96.7 million in the first nine months of 201 8 , compared to $ 258.2 m illion during the same period of 201 7 . Diluted net income per ADS was $ 1. 57 during the first nine months of 201 8 , compared to $ 1.07 in the same period of 201 7 . Non - GAAP diluted net income per ADS (note 1) was $ 1. 87 during the first nine months of 201 8 , compared to $ 1.24 in the same period of 201 7 . Net cash provided by operating activities was $ 3 36.5 million during the first nine months of 201 8 , compared to $ 308.0 m illion in the same period of 201 7 . Recent Development - c hanges to the Board of Directors 4 The Company also announced several changes to its board of directors (the “ Board ” ). Mr. Yongming Wu, a director and founding partner of Vision Plus Capital and a co - founder of Alibaba Group, has been appointed to be a director of Momo ’ s Board, effective on December 3, 2018. Mr. Wu founded Vision Plus Capital in 2015 and has led several key business segments of Alibaba Group. In addition, Mr. Neil Nanpeng Shen resigned from the Board on December 1, 2018, effective immediately. The resignation of Mr. Neil Nan peng Shen was not due to any disagreement with the Company regarding its business, finance, accounting and/or any other affairs. Business Outlook For the fourth quarter of 2018, the Company expects total net revenues to be between RMB3,655.0 m illion to RMB3,755.0 m illion , representing an increase of 4 3 % to 4 7 % year over year and a n increase of 0 % to 3 % quarter over quarter, on a constant currency basis. Excluding the revenues from Phanta City, the Company expects the total revenues for the fourth quarter of 2018 to be between RMB3,624.0 m illion to RMB3,724.0 million , representing an increase of 4 2 % to 4 6 % year over year and an increase of 4 % to 7 % quarter over quarter , on a constant currency basis. The Company is not providing the business outlook in USD terms due to the recent volatility and uncertainty in foreign exchange rate. These estimates reflect the Company's current and preliminary view, which is subject to change. Note 1: Non - GAAP measures To supplement our consolidated financial statements presented in accordance with U.S. generally accepted accounting principles ( “ GAAP ” ), we use various non - GAAP financial measures that are adjusted from the most comparable GAAP results to exclude share - based compensation and amortization of intangible asset s from acquisitions , and provision for income tax related to the amortization of intangibl
5 e assets . Reconciliations of our n
e assets . Reconciliations of our non - GAAP financial measures to our U.S. GAAP financial measures are shown in tables at the end of this earnings release, which prov ide more details about the non - GAAP financial measures. Our non - GAAP financial information is provided as additional information to help investors compare business trends among different reporting periods on a consistent basis and to enhance investors ’ overall understanding of the historical and current financial performance of our continuing operations and our prospects for the future. Our non - GAAP financial information should be considered in addition to results prepared in accordance with GAAP, but sh ould not be considered a substitute for or superior to the GAAP results. In addition, our calculation of the non - GAAP financial measures may be different from the calculation used by other companies, and therefore comparability may be limited. Our non - GAA P information (including non - GAAP cost and operating expenses, income from operations, net income attributable to Momo Inc., and diluted earnings per ADS) is adjusted from the most comparable GAAP results to exclude share - based compensation , amortization o f intangible assets from acquisitions , and provision for income tax related to the amortization of intangible assets . A limitation of using these non - GAAP financial measures is that share - based compensation , amortization of intangible assets from acquisiti ons and provision for income tax related to the amortization of intangible assets charge has been and will continue to be for the foreseeable future a 5 significant recurring expense in our results of operations. We compensate for these limitations by provid ing reconciliations of our non - GAAP measures to our U.S. GAAP measures. Please see the reconciliation tables at the end of this earnings release. Conference Call Momo's management will host an earnings conference call on Thursday , December 6 , 2018 at 8:00 a. m. U.S. Eastern Time ( 9 :00 p.m. Beijing / Hong Kong Time on December 6 , 2018 ). Dial - in details for the earnings conference call are as follows: International: +65 - 67 1 3 - 5090 U.S. Toll Free: +1 - 866 - 519 - 4004 Hong Kong Toll Free: 800 - 906601 Mainland China: 4006 - 208038 Passcode: Momo Please dial in 15 minutes before the call is scheduled to begin. A telephone replay of the call will be available after the conclusion of the conference call through 8: 00 a.m. U.S. Eastern Time, December 1 4 , 2018 . The dial - in details for the replay are as follows: International: +61 - 2 - 8199 - 0299 U.S. Toll Free: +1 - 855 - 45
6 2 - 5696 Passcode: 3986625 Addit
2 - 5696 Passcode: 3986625 Additionally, a live and archived webcast of the conference call will be available on the Investor Relations section of Momo's website at http://ir.immomo.com. About Momo Momo is a leading mobile social networking platform in China. Momo connects people in a personal and lively way through a revolutionary mobile - based social networking platform. With powerful and precise l ocation - based features, Momo enables users to connect with each other and expand relationships from online to offline. Momo's platform includes the Momo mobile application and a variety of related features, functionalities, tools and services that it provi des to users, customers and platform partners. Leveraging its social interest graph engine and analysis of user behavior data, Momo is able to provide users a customized experience based on their social preferences and needs. Momo users can maintain and st rengthen their relationships through private and group communication tools, content creation and sharing functions, as well as the offline social activities promoted on Momo's platform. Momo users are also able to enjoy live video on our platform. In addit ion, in May 2018, Momo completed its acquisition of Tantan, a leading social and dating app for the younger generation. Tantan, whose primary users consist of young Chinese singles, is designed to help its users find and establish romantic connections, as well as meet interesting people. For investor and media inquiries, please contact: Momo Inc. Investor Relations 6 Phone: +86 - 10 - 5731 - 0538 Email: ir@immomo.com Christensen In China Mr. Christian Arnell Phone: +86 - 10 - 5900 - 1548 E - mail: carnell@christensenir.com In US Ms. Linda Bergkamp Phone: +1 - 480 - 614 - 3004 Email: lbergkamp@christensenir.com Safe Harbor Statement This news release contains "forward - looking" statements within the meaning of Section 27A of the Securities Act of 1933, as amended, and Section 21E of the Securities Exchange Act of 1934, as amended, and as defined in the Private Securities Litigation Reform Act of 1995. These forward - looking statements include but are not limited to our management quotes and our financial outlook for the fourth quarter of 201 8 . Our forward - looking statements are not historical facts but instead represent only our belief regarding expected results and events, many of which, by their nature, are inherently uncertain and o utside of our control. Our actual results and other circumstances may differ, possibly materially, from the anticipated results and events indicated in these forward - looking statements. Announced results for the third
7 quarter of 201 8 are preliminary, un
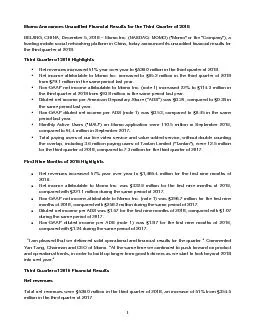
quarter of 201 8 are preliminary, unaud ited and subject to audit adjustment. In addition, we may not meet our financial outlook for the fourth quarter of 201 8 and may be unable to grow our business in the manner planned. We may also modify our strategy for grow th . In addition, there are other risks and uncertainties that could cause our actual results to differ from what we currently anticipate, including those relating to our ability to retain and grow our user base, our ability to attract and retain sufficiently trained professionals to suppo rt our operations, and our ability to anticipate and develop new services and enhance existing services to meet the demand of our users or customers. For additional information on these and other important factors that could adversely affect our business, financial condition, results of operations, and prospects, please see our filings with the U.S. Securities and Exchange Commission. All information provided in this press release and in the attachments is as of the date of the press release. We undertake no obligation to update any forward - looking statement, whether as a result of new information, future events or otherwise, after the date of this release, except as required by law. Such information spea ks only as of the date of this release. 7 Momo Inc. Unaudited Condensed Consolidated Statement of Operations (US dollars in thousands, except per share data) Three month s First nine months e nded September 30 e nded September 30 201 7 201 8 201 7 201 8 Net revenues : Live video service 302,603 406,905 774,597 1,189,378 Value - added service 26,256 84,216 73,759 176,428 Mobile marketing 17,441 17,241 54,348 58,214 Mobile games 8,024 4,097 28,728 16,198 Other services 129 23,511 483 25,151 Total net revenues 354,453 535,970 931,915 1,465,369 Cost and expenses: Cost of revenues (177,967) (298,527) (449,079) (777,871) Research and development (13,855) (36,097) (32,731) (78,699) S ales and marketing (57,734) (82,809) (160,815) (181,704) General and administrative (16,792) (24,713) (44,870) (61,947) Total cost and expenses (266,348) (442,146) (687,495) (1,100,221) Other operating income 897 779 9,371 17,558 Income fr om operations 89,002 94,603 253,791 382,706 Interest income 6,029 12,155 14,4 09 27,934 I nterest expense - (3,588) - (5,538) I mpairment loss on long - term investments - - (4,386) - I
8 ncome before income tax and share of in
ncome before income tax and share of income on equity method investments 95,031 103,170 263,814 405,102 Income tax expenses (17,218) (21,567) (46,933) (79,615) Income before share of income on equity method investments 77,813 81,603 216,881 325,487 Share of income on equity method investments 1,166 2,428 3,863 5,399 Net income 78,979 84,031 220,744 330,886 Less: net loss attributable to non - controlling interest (110) (1,125) (315) (1,933) Net income attributable to Momo Inc. 79,089 85,156 221,059 332,819 Net income per share attributable to ordinary shareholders Basic 0.20 0.21 0.56 0.82 Diluted 0.19 0.20 * 0.53 0.78 * Weighted average shares used in calculating net income per ordinary share Basic 395,926,878 409,378,536 393,469,398 404,744,362 Diluted 417,066,439 445,871,236 414,884,571 428,148,904 * Net income attributable to Momo is adjusted for interest expense of C onvertible Senior Notes for calculation of dilutive EPS. 8 Momo Inc. Unaudited Condensed Consolidated Statement of Comprehensive Income (US dollars in thousands, except per share data) Three month s First nine months e nded September 30 e nded September 30 201 7 201 8 201 7 201 8 Net income 78,979 84,031 220,744 330,886 Other comprehensive income (loss) , net of tax of nil F oreign currency translation adjustment 9,0 21 (36,753) 17,96 4 (60,755) Comprehensive income 88,000 47,278 238,708 270,131 Less: comprehensive loss attributed to the non - controlling interest (11 5 ) (1,192) (32 2 ) (2,017) Co m prehensive income attribut able to Momo Inc. shareholders 88,115 48,470 239,030 272,148 9 Momo Inc. Unaudited Condensed Consolidated Balance Sheets ( US dollars in thousands) December 31 September 30 201 7 201 8 Assets Current assets Cash and cash equivalents 685,827 285,195 Term deposits 373,794 1,182,454 Restricted cash - 9,208 Short - term investment 1,614 16,744 Accounts receivable, net of allowance for doubtful accounts of $ 90 and $nil as of December 31, 201 7 and September 3 0 , 201 8 , respectively 39,597 92,404 Prepaid expenses and other current assets 82,717 91,892 Amount due from related parties 5,143 8 Total current a
9 ssets 1,188,692 1,677,905 Proper
ssets 1,188,692 1,677,905 Property and equipment , net 39,762 48,776 Intangible assets 7,462 156,549 Rental deposits 2,651 2,931 Long term investments 44,337 67,326 Defe rred tax assets, non - current 7,197 2,608 Other non - current assets 8,495 10,898 Goodwill 3,40 1 626,406 Total assets 1,301,997 2,593,399 Liabilities and equity Current liabilities Accounts payable 74,535 104,836 Deferred revenue 64,865 62,525 Accrued expenses and other current liabilities 87,809 89,732 Amount due to related parties 5,804 8,380 Income tax payable 27,033 12,645 Deferred consideration in connection with business acquisitions - 74,131 Total current liabilities 260,046 352,249 Deferred tax liabilit ies , non - current 1,866 39,137 Share - based compensation liability - 4,323 Convertible Senior Notes - 708,771 Other non - current liabilities 2,305 3,807 Total liabilities 264,217 1,108,287 Shareholder ’ s equity (Note a) 1,037,780 1,485,112 Total liabilities and shareholder ’ s equity 1,301,997 2,593,399 Note a: A s of September 30 , 201 8 , the number of ordinary shares issued and outstanding wa s 413,200,744 . 10 Momo Inc. Unaudited Condensed Consolidated Statement of Cash Flows (US dollars in thousands) Three month s First nine months e nded September 30 e nded September 30 201 7 201 8 201 7 201 8 Cash flows from operating activities: Net income 78,979 84,031 220,744 330,886 Adjustments to reconcile net income to net cash provided by operating activities: Depreciation of property and equipment 3,220 5,773 7,805 16,232 Amortization of intangible assets 269 5,720 452 8,007 Share - based compensation 14,664 24,974 37,171 58,367 Share of income on equity method investment (1,166) (2,428) (3,863) (5,399) Impairment loss on long - term investments - - 4,386 - Income on disposal of property and equipment - (182) (2) (182) Provision of allowance for doubtful accounts - - 85 (92) Changes in operating assets and liabilities: Accounts receivable 6,605 (61,716) 6,287 (51,595) Prepaid expenses and other current assets (10,429) (26,885) (23,045) (14,363) Amount due from related parties (506) 1,966 (1,019) 5,102 Rental deposits (27) (85) (1,467) 44 Deferred tax assets - 50 73 4,535 Other non - current assets
10 (1,046) (980) (1,827) (6,97
(980)
(1,827)
(6,97")
(1,046) (980) (1,827) (6,976) Accounts payable 14,339 23,363 25,960 38,089 Income tax payable 800 (726) 8,843 (15,365) Deferred revenue 1,966 4,790 3,299 (4,532) Accrued expenses and other current liabilities (5,574) (7,692) 19,702 (28,312) Amount due to related parties 2,638 2,536 3,846 2,602 Deferred tax liability (47) (1,430) (93) (2,001) Other non - current liabilities (109) (182) 684 1,501 Net cash provided by operating activities 104,576 50,897 308,021 336,548 Cash flows from investing activities: Purchase of property and equipment (7,937) (10,491) (19,281) (24,673) Payment for acquired intangible assets (228) - (2 ,993 ) - Proceeds from disposal of property and equipment 1 323 8 324 Payment for long term investments (1,350) (1,176) (4,979) (9,666) Prepayment of long term investments - - - (7,398) Payment for business acquisition - - - (514,919) Purchase of term deposits (127,781) (1,089,995) (519,749) (2,279,078) Cash received on maturity of term deposits 99,984 308,569 484,093 1,442,514 Payment for short term investments (855) (52,045) (855) (52,045) Cash received from sales of short term investment - 35,148 - 36,801 Net cash used in investing activities (38,166) (809,667) (63,756) (1,408,140) Cash flows from financing activities: Proceeds from exercise of option s 51 414 461 807 Deferred payment of purchase of property and equipment (13) - (217) (1,322) Capital contribution from non - controlling interest shareholder 73 - 73 - Proceeds from bank loan - - - 300,000 Repayment of bank loan - (300,000) - (300,000) Proceeds from issuance of C onvertible Senior N otes, net of issuance cost of $16,703 - 708,297 - 708,297 Net cash provided by financing activities 111 408,711 317 707,782 Effect of exchange rate changes 7,110 (18,932) 14,573 (27,614) Net increase (decrease) in cash, cash equivalent and restricted cash 73,631 (368,991) 259,155 (391,424) Cash, cash equivalent and restricted cash at beginning of period 443,088 663,394 257,564 685,827 Cash, cash equivalent and restricted cash at end of period 516,719 294,403 516,719 294,403 11 Momo Inc. Reconciliation of Non - GAAP financial measures to comparable GAAP measures (US dollars in thousands, except per share data)
11 1. Reco nciliation of Non - GAAP co
1. Reco nciliation of Non - GAAP cost and operating expenses , income from operations, and net income to comparable GAAP measures. Three months Three months e nded September 30 , 201 7 e nded September 30 , 201 8 GAAP S hare - based compen sation Non - GAAP GAAP A mortization of intangible assets from acquisitions S hare - based compensa tion Non - GAAP Cost of revenues (177,967) 632 (177,335) (298,527) 2,672 864 (294,991) Research and development (13,855) 2,751 (11,104) (36,097) 339 6,747 (29,011) Sales and marketing (57,734) 3,492 (54,242) (82,809) 2,499 6,430 (73,880) General and administrative (16,792) 7,789 (9,003) (24,713) - 10,933 (13,780) Cost and operating expenses (266,348) 14,664 (251,684) (442,146) 5,510 24,974 (411,662) Income from operations 89,002 14,664 103,666 94,603 5,510 24,974 125,087 Net income attributable to Momo Inc. 79,089 14,664 93,753 85,156 4,133 (a) 24,974 114,263 First nine months First nine months e nded September 30 , 201 7 e nded September 30 , 201 8 GAAP S hare - based compen sation Non - GAAP GAAP A mortization of intangible assets from acquisitions S hare - based compensa tion Non - GAAP Cost of revenues (449,079) 1,385 (447,694) (777,871) 3,563 2,478 (771,830) Research and development (32,731) 6,218 (26,513) (78,699) 452 16,097 (62,150) Sales and marketing (160,815) 8,601 (152,214) (181,704) 3,332 15,136 (163,236) General and administrative (44,870) 20,967 (23,903) (61,947) - 24,656 (37,291) Cost and operating expenses (687,495) 37,171 (650,324) (1,100,221) 7,347 58,367 (1,034,507) Income from operations 253,791 37,171 290,962 382,706 7,347 58,367 448,420 Net income attributable to Momo Inc. 221,059 37,171 258,230 332,819 5,511 (b) 58,367 396,697 Note s: (a) Adjustments to exclude the provision for income tax related to amortization of intangible assets from acquisitions of $1,377 from the unaudited condensed consolidated statements. (b) Adjustments to exclude the provision for income tax related to amortization of intangible assets from acquisitions of $ 1,836 from the unaudited conden sed consolidated stat