/
Source-based Code Coverage Source-based Code Coverage

Source-based Code Coverage - PowerPoint Presentation

jaena
jaena . @jaena
Follow
64 views
Uploaded On 2024-01-29

Source-based Code Coverage - PPT Presentation

for Embedded Use Cases Alan Phipps Texas Instruments Cody Addison Nvidia 2020 LLVM Developers Meeting October 2020 1 What is Code Coverage A measurement for how thoroughly code has been executed during testing ID: 1042434

profile data coverage llvm data profile llvm coverage code counter sections prf size counters runtime writing records memory function

Share:

Link:

Embed:

Download Presentation from below link

Download Presentation The PPT/PDF document "Source-based Code Coverage" is the property of its rightful owner. Permission is granted to download and print the materials on this web site for personal, non-commercial use only, and to display it on your personal computer provided you do not modify the materials and that you retain all copyright notices contained in the materials. By downloading content from our website, you accept the terms of this agreement.


Presentation Transcript

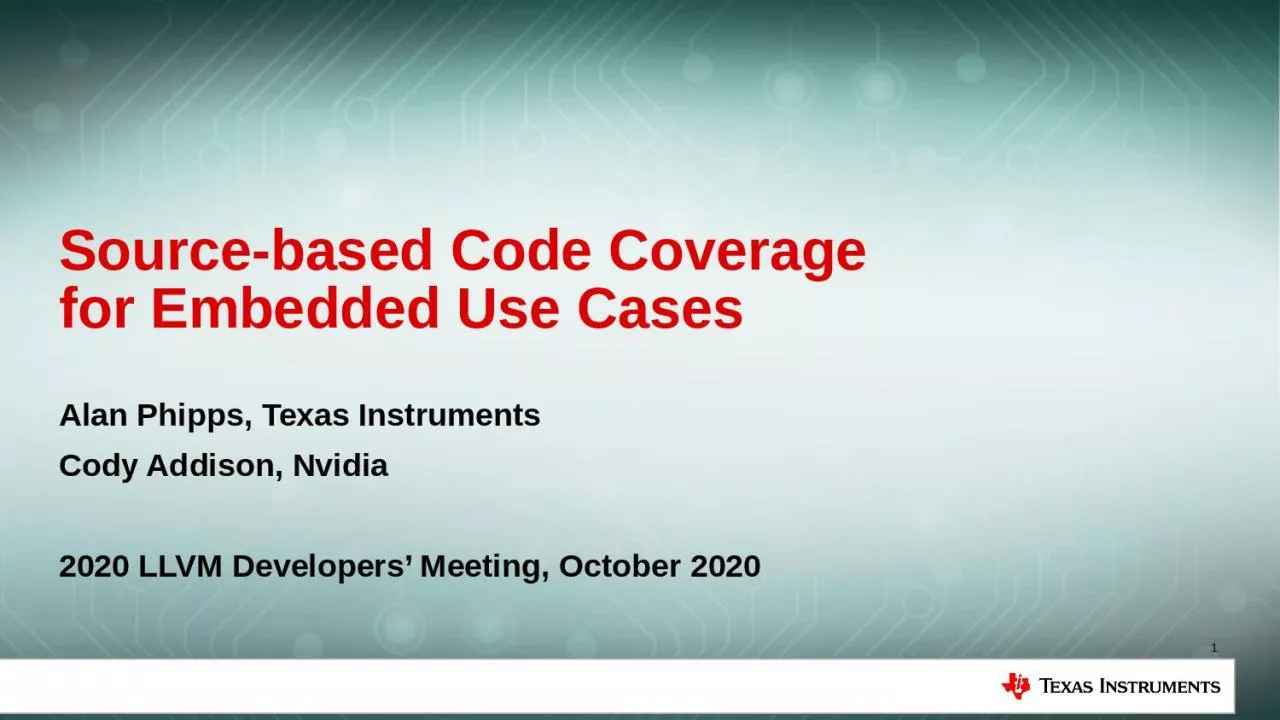
1. Source-based Code Coveragefor Embedded Use CasesAlan Phipps, Texas InstrumentsCody Addison, Nvidia2020 LLVM Developers’ Meeting, October 20201

2. What is Code Coverage?A measurement for how thoroughly code has been executed during testingAll sections of code have an associated testUn-executed code may be at higher risk of having lurking bugs2

3. The ChallengeEmbedded devices usually have tight memory requirementsLLVM Source-based Code Coverage has large size requirementsAdditional instructions added to instrument your codeAdditional runtime code to control profile data mergingThis includes counter merging and profile data input and outputAdditional data sections to track counters and coverage dataThere ARE things we can do to reduce the size!3MemoryCodeDataMemoryCodeData

4. 1. Must all data sections be in memory?No!Code Coverage relies on several data sections:__llvm_prf_cnts : Profile counters, incremented at runtime__llvm_covfun : Coverage Function Records__llvm_covmap : Coverage Mapping Data Records__llvm_prf_data : Profile Data__llvm_prf_names : Profile Function names4These sections may comprise 80%-90% of the data but do not require runtime modification

5. 1. Must all data sections be in memory?No!Code Coverage relies on several data sections:__llvm_prf_cnts : Profile counters, incremented at runtime__llvm_covfun : Coverage Function Records__llvm_covmap : Coverage Mapping Data Records__llvm_prf_data : Profile Data__llvm_prf_names : Profile Function namesModify llvm-profdata to accept an object file argument Move it off-line: Combine its data with downloaded profile counters, producing an indexed profile data file5Move these sections out of memory, preserved in object file

6. 2. Can we reduce runtime support?We just moved most processing of raw profile data off-lineRuntime features are included that are unnecessary for embedded platformsRuntime counter mergingUse of environment variable to control where output goesIndexed profile writing outputBuffering data for writing outputReading data input in for profile-guided optimization (PGO)How big is libclang_rt.profile.a? 100kb for Armv7m! 6compiler-rt/lib/profile/CMakeLists.txt:set(PROFILE_SOURCES GCDAProfiling.c InstrProfiling.c InstrProfilingInternal.c InstrProfilingValue.c InstrProfilingBiasVar.c InstrProfilingBuffer.c InstrProfilingFile.c InstrProfilingMerge.c InstrProfilingMergeFile.c InstrProfilingNameVar.c InstrProfilingVersionVar.c InstrProfilingWriter.c InstrProfilingPlatformDarwin.c InstrProfilingPlatformFuchsia.c InstrProfilingPlatformLinux.c InstrProfilingPlatformOther.c InstrProfilingPlatformWindows.c InstrProfilingRuntime.cpp InstrProfilingUtil.c )

7. 2. Can we reduce runtime support?We just moved most processing of raw profile data off-lineRuntime features are included that are unnecessary for embedded platformsRuntime counter mergingUse of environment variable to control where output goesIndexed profile writing outputBuffering data for writing outputReading data input in for profile-guided optimization (PGO)How big is libclang_rt.profile.a? 100kb for Armv7m!If we only support for basic writing of counters and remove everything else  4kb for Armv7m!7compiler-rt/lib/profile/CMakeLists.txt:set(PROFILE_SOURCES GCDAProfiling.c InstrProfiling.c InstrProfilingInternal.c InstrProfilingValue.c InstrProfilingBiasVar.c InstrProfilingBuffer.c InstrProfilingFile.c InstrProfilingMerge.c InstrProfilingMergeFile.c InstrProfilingNameVar.c InstrProfilingVersionVar.c InstrProfilingWriter.c InstrProfilingPlatformDarwin.c InstrProfilingPlatformFuchsia.c InstrProfilingPlatformLinux.c InstrProfilingPlatformOther.c InstrProfilingPlatformWindows.c InstrProfilingRuntime.cpp InstrProfilingUtil.c )

8. 3. What about counter size?Remember…. we made __llvm_prf_cnts the only coverage data section in memoryBut this is comprised of counters that are 64bits in sizeEmbedded applications can get away with smaller counter sizesReduce the counter size to 32bits – 50% reduction in size!Even better: make counter size configurable to any reasonable size (16bits, 8bits)Use saturating addition to prevent against overflow on small counter sizes8cnt0cnt2cnt1cnt3cnt0cnt1cnt3cnt4cnt2cnt5cnt6cnt70… 64… 128… 192…0… 32… 64… 96… 128… 160… 192… 224…

9. Thank you!9