
abiotic conditions A traveler should be a botanist for in all views plants form the chief embellishment Charles Darwin The Voyage of the Beagle Belize AnzaBorrego Desert California Manning Park ID: 1026004
Download Presentation The PPT/PDF document "Community Ecology The study of how abund..." is the property of its rightful owner. Permission is granted to download and print the materials on this web site for personal, non-commercial use only, and to display it on your personal computer provided you do not modify the materials and that you retain all copyright notices contained in the materials. By downloading content from our website, you accept the terms of this agreement.


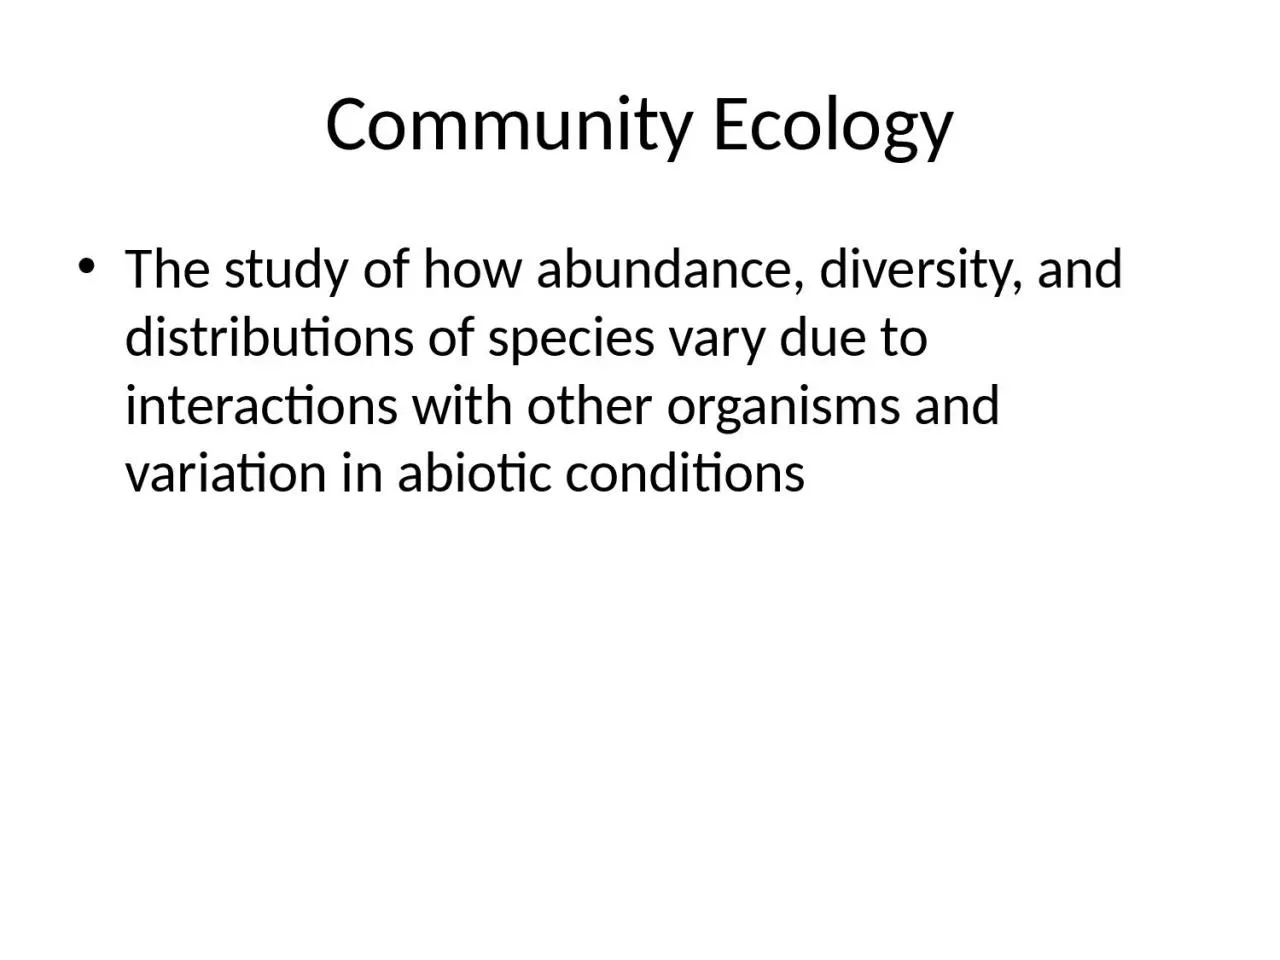
1. Community EcologyThe study of how abundance, diversity, and distributions of species vary due to interactions with other organisms and variation in abiotic conditions
2. A traveler should be a botanist, for in all views plants form the chief embellishmentCharles Darwin,The Voyage of the BeagleBelize
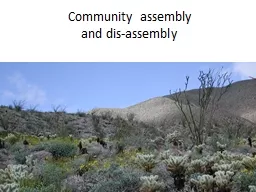
3. Anza-Borrego Desert, California
4. Manning ParkRhododendron Flats
5. TEMPERATE EVERGREEN COASTAL RAINFORESTTEMPERATE SCLEROPHYLLOUS WOODLAND AND SHRUBLANDBOREAL FORESTARCTIC TUNDRA
6. Bird species richness in the Western Hemisphere (Hawkins et al. 2006)
7. Table Rock, Oregon
8. www.wildiaries.com
9. Food web of Bear Island: Summerhayes and Elton 1923, Journal of Ecology, 11, 214-286
10. Questions in Community EcologyWhy are some species more common than others? What causes spatial and temporal patterns of community change? What are the consequences of diversity patterns for community processes?Can we explain patterns of organization by invoking some universal laws?
11. A cautionary tale: body sizeHutchinson’s “Homage to Santa Rosalia” (1959)posited that coexisting animals (at the same level in a food web) tend to differ in size by a ratio of roughly 1.3 (hypothetically due to character displacement after competition).With thanks to Peter Morin
12. Largest species (puncata) can occur with others (affinis and macrocephala), but two small spp shouldn’t coexist—due to competitive exclusion.
13. Horn and May (1977) showed that the “1.3 rule” also held for non-biological communities
14. Simberloff and Boecklen (1981) suggested true statistical tests needed (the beginning of the null model movement), and found many reported 1.3 ratios not significant
15. In some cases, depending on the model, body sizes WERE found to be “overdispersed”Sonoran Desert Rodent “Hutchinsonian ratios”Brown 1975Bowers and Brown 1982
16. ApproachesCommunity ecology often asks: how do interactions lead to the pattern of organisms/traits?Experiments, models, observation/inference, often small spatial scalesMacroecology asks: what can we infer about processes from the distribution of organisms/traits?Statistical patterns, usually large spatial or temporal scales
17. Figure 1.9. The species composition of a local community at any time is a consequence of many factors interacting in a hierarchical fashion. The composition of the species pool of potential community members depends on past evolutionary and historical events, as well as physiological constraints. Dispersal ability and habitat selection influence which members of the species pool arrive in a particular location. Interspecific interactions among those species that manage to arrive in a particular place further inhibit or facilitate the inclusion of species in the community. Morin 1999
18. Course TopicsCompetitionPredation (incl. trophic cascades)Mutualisms/indirect effects MacroecologyDiversity (and neutral theory)Metabolic theoryCommunity Assembly
19. Direct effects are indicated by solid lines, with signs corresponding to the signs of interactions between the species. Net indirect effects are indicated by broken lines. Morin 1999Types of interactions
20. Interaction StrengthInteraction strength (IS) often measured by species deletions, with varying response metricsexperiment length important (time for interactions to manifest), as are density and species composition. Details on metrics in Laska and Wooton, 1998, and Berlow et al, 1999; more recent review in Wooton and Emerson, 2005
21. Interaction StrengthIS as per-capita impact (short term impact of one individual on an individual of another species)There are also several modelling approaches; one popular group is perturbation models (impact of one individual on a population of another species)
22. Empirical IS indices (Berlow et al)
23. How can interaction strength be measured?Or, a short primer on how to do community ecology
24. Field experiments 1Paine 1992; removed herbivores from intertidal, measured impact on algae(E-C)/CMFew strong negative impacts of consumers; positive impacts due to indirect interactionsSea urchinChitonLimpets and chitonsE = ExperimentalC = ControlM = density of manipulated species
25. Field ObservationsWooton 1997; uses methods of dynamic food web models to measure per capita consumption and assimilation in birdsEstimated population sizes, consumption rates, took into account time spent searching or sleeping vs. feeding, and time at low tide (when intertidal species available)—observational impact similar to estimates from experiments
26. Wooton analyzed feeding patterns of 17 species of birds, same island as Paine
27. Lab experiments 1Morin et al 1988 measured interaction strength for competitors in experimental ponds: frogs and aquatic insects
28. Lab experiments 2Schmitz 1997; studied old field food webs (grasshoppers, plants, nitrogen)using field and lab experimentsLab experiments manipulated top-down (herbivore) and bottom-up (nitrogen) factors separately for each plant species; compared with field experiment manipulating both simultaneously for the community.
29.
30. Inference based on species traits (e.g. relative body sizes of predators and their prey)Wooton Emerson 2005
31. Pros and cons of different methodsRemovals assume equilibrium, do not always effectively estimate indirect effects, and Paine’s index does not work well for rare species—otherwise is practicalDynamic index (Wootton) best when community is far from equilibrium (better for comparing short-term results) or when both positive and negative effects occurObservational approaches good when experimentation is not feasible, but require validation
32. Interaction-strength distributionsUsually many weak and few strong
33. Abiotic conditions and interaction strengthMenge et al 1996: compared predation on mussels in wave exposed vs protected
34. Lawton 1999: “Community ecology is a mess”“The rules are contingent in so many ways….as to make the search for patterns unworkable”
35. Vellend 2010Selection: processes determining relative success (competition, predation, disease)Drift: changes in abundance to due random effectsSpeciation: generation of diversity in regional species poolsDispersal: movement in and out of local communities
36. To Read for next time:Two Papers from TREE, posted on web page, for a discussion of format (mostly) but ideas in the paper are cool too!
37. Abrams, P. A. 2001 Describing and quantifying interspecific interactions: a commentary on recent approaches. Oikos 94: 209-218.Berlow, E. L., S. A.Navarrette, C. J. Briggs, M. E. Power, and B. A. Menge. 1999. Quantifying variation in the strengths of species interactions. Ecology 80: 2206-2224.Bowers, M. A. and J. H. Brown. 1982. Body size and coexistence in desert rodents: Chance or community structure? Ecology 63: 391-400.Brown, J. H. 1975. Geographical ecology of desert rodents. Pages 315-341 in M. L. Cody and J. M. Diamond, eds, Ecology and Evolution of CommunitiesHorn, H.S and R. M. May. 1977. Limits to similarity among coexisting competitors. Nature 270: 660-661.Hutchinson, G. E. 1959. Homage to Santa Rosalia, or, why are there so many kinds of animals? Am Nat 870: 145-159.Laska, M. S. and J. T. Wootton. 1998. Theoretical concepts and empirical approaches to measuring interaction strength. Ecology 79: 461-476.Lawton, J. H. 1999. Are there general laws in ecology? Oikos 84: 177-192Lewin., R. 1983. Santa Rosalia was a goat. Science 221(4611): 636-639.Menge, B. A., B. Daley, and P. A. Wheeler. 1996. Control of interaction strength in marine benthic communities. pp. 258-274 in G. A. Polis and K. O. Winemiller (eds) Food Webs: Integration of patterns and dynamics. Chapman and Hall.Morin, P. J., S. P. Lawler, and E. A. Johnson. 1988. Competition between aquatic insects and vertebrates: interaction strength and higher order interactions. Ecology 69:1401–1409.Paine, R. T. 1992. Food-web analysis through field measurement of per capita interaction strength. Nature 355: 73-75.Pajunen, V. I. 1982. Replacement analysis of non-equilibrium competition between rock-pool corixids. Oecologia 52: 153-155. Power, M. E., et al. 1996. Challenges in the quest for keystones. BioScience 46:609-620.Sala, E. and M. H. Graham. 2002. Community-wide distribution of predator-prey interaction strength in kelp forests. PNAS 99:3678-3683.Schmitz O.J. 1997. Press perturbations and the predictability of ecological interactions in a food web. Ecology 78:55–69Simberloff, D. S., and W. Boecklen. 1981. Santa Rosalia reconsidered: Size ratios and competition. Evolution 35:1206-1228.Summerhayes, V. S. and C. S. Elton. 1923. Contributions to the ecology of Spitsbergen and Bear Island. Journal of Ecology 11: 214-286.Travis, J. 1996. The significance of geographical variation in species interactions. Am Nat 148: S1-S8.Vellend, M. 2010. Conceptual synthesis in community ecology. Quarterly Review of Biology 85: 183-206Wooton, J. T. 1997. Estimates and tests of per capita interaction strength: diet, abundance, and impact of intertidally foraging birds. Ecological Monographs 67: 45-64.Wooton, J. T. and M. Emmerson. 2005. Measurement of interaction strength in nature. Annu. Rev. Ecol. Evol. Syst. 36: 419-444.