
Part I Zeller and Harper 77 H ISTORICAL P ERSPECTIVE OF S ABAH S M ARINE F ISHERIES 1 Louise S Teh a Lydia C Teh a Dirk Zeller a and Annadel Cabanban b a Sea Around Us Project ID: 846215
Download Pdf The PPT/PDF document "Fisheries catch reconstructions Islands" is the property of its rightful owner. Permission is granted to download and print the materials on this web site for personal, non-commercial use only, and to display it on your personal computer provided you do not modify the materials and that you retain all copyright notices contained in the materials. By downloading content from our website, you accept the terms of this agreement.


1 Fisheries catch reconstructions: Islands
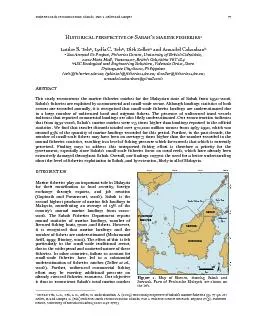
Fisheries catch reconstructions: Islands , Part I, Zeller and Harper 77 H ISTORICAL P ERSPECTIVE OF S ABAH â S M ARINE F ISHERIES 1 Louise S. Teh a , Lydia C. Teh a , Dirk Zeller a and Annadel Cabanban b a Sea Around Us Project, Fisheries Centre, University of British Columbia, 2202 Main Mall, Vancouver, British Columbia V6T 1Z4 b ASC Ecological and Engineering Solutions, Valencia Drive, Daro Dumaguete City 6200, Philippines l.teh@fisheries.ubc.ca; lydia.teh@fisheries.ubc.ca; d.zel ler@fisheries.ubc.ca ; annadel.cabanban@gmail.com A BSTRACT This study reconstructs the marine fisheries catches for the Malaysian state of Sabah from 1950 - 2006. Sabahâs fisheries are exploited by a commercial and small - scale sector. Although landings stat istics of both sectors are recorded annually, it is recognized that small - scale fisheries landings are underestimated due to a large number of unlicensed local and migrant fishers. The presence of unlicensed trawl vessels indicates that reported commercial landings are also likely underestimated. Our reconstruction indicates that from 1950 - 2006, Sabahâs marine catches were 2.5 times higher than landings reported in the official statistics. We find that trawler discards totaled over 970,000 million tonnes fr om 1965 - 1990, which was around 95% of the quantity of marine landings recorded for this period. Further, in the past decade, the number of small - scale fishers may have been on average 3 times higher than the number recorded in the annual fisheries statisti cs, resulting in a level of fishing pressure which far exceeds that which is currently perceived. Finding ways to address this unreported fishing effort is therefore a priority for the government, especially since Sabahâs small - scale fisheries focus on cor al reefs, which have already been extensively damaged throughout Sabah. Overall, our findings suggest the need for a better understanding about the level of fisheries exploitation in Sabah, and by extension, likely in all of Malaysia. INTRODUCTION Mari ne fisheries play an important role in Malaysia for their contribution to food security, foreign exchange through exports, and job creation (Gopinath and Puvanesuri, 2006). Sabah is the second highest producer of marine fish landings in Malaysia, contribut ing an average of 15% of the countryâs annual marine landings from 2000 - 2006. The Sabah Fisheries Department reports annual statistics o f marine landings, number of licensed fishing boats, gears, and fishers. However, it is recognized that marine landings and the number of fishers are underestimated (Mohammad Ariff, 1999; Biusing, 2001). The effect of this is felt particularly in the small - scale traditional sector, due to the widespread and scattered nature of these fisheries. In other countries, failure to account for small - scale fisheries have led to a substantial underestimation of fisheries catches (Zeller et al. , 2006). Further, unlicensed commercial fishing effort may be exerting additional pressure on already stressed fisheries resources. Our objectiv e is thus to reconstruct Sabahâs total marine catches 1 Cite as : Teh, L. S., Teh, L. C., Zeller, D. and Cabanban, A. ( 2009 ) Historical perspective of Sabahâs marine fisheries. p p . 77 - 98. In : Zeller, D. and Harper, S. (ed s .) Fisheries catch reconstructions: Islands, Part I. Fisheries Centre Res earch Reports 17 (5). Fisheries Centre, University of British Columbia [ ISSN 1198 - 6727 ]. Figure 1 . Map of Borneo , showing Sabah and Sarawak . Parts of Peninsular Malaysia are shown on the left . 78 Fisheries catch reconstructions: Islands , Part I , Zeller and Harper for the years 1950 - 2006 to present a more complete estimate of the quantity of fisheries resources taken from Sabah waters. Sabahâs marine fisheries Sabah is a state of Malaysia, situated on the nort heast corner of Borneo (Figure 1). The state polices the
2 territorial waters extending up to tw
territorial waters extending up to twelve nautical miles, while the federal government has jurisdiction over an Exclusive Economic Zone (EEZ), measured as either 200 nautical miles (nm) from shore or the mid - line between neighboring countriesâ landmasses. Sabah is bordered by the South China Sea in the west, the Sulu Sea to the north - east, and the Sulawesi Sea to the south - east (Figure 1). Mangroves and mudflats fringe the coastal zone, and many outly ing islands are scattered offshore. Coral reefs are present in shallow w aters throughout the stateâs coast, and are heavily exploited by Sabahâs substantial population of subsistence and artisanal fishers. Sabahâs marine capture fisheries are exploited b y the commercial and small - scale sectors, which accounted for approximately 65% and 35% of annual total fisheries landings in 2004, respectively. The term âtraditionalâ is used by the Sabah Fisheries Department to refer to small - scale fisheries, and we use both terms synonymously in this study. Marine landings consist of pelagic and demersal species. In 2006, recorded landings were approximately split evenly between pelagic and demersal fishes. Demersal landings were made up of finfish (75%), invertebrates (15%), and shrimp (10%). The Sabah Fisheries Department classifies trawlers and purse seines as commercial gears, of which trawlers are the dominant gear. Traditional gears include hook and line, which accounts for the highest traditional fish landings, gi llnets, lift nets, bag nets, push scoop nets, traps, and shellfish collection. The majority of Sabahâs capture fisheries occurs within approximately 30 km (16.2 nautical miles) from the coast, as there are few vessels in Sabah larger than 70 GRT that are capable of deep sea fishing (Biusing, 2001). A spatial zoning system defines the boundaries where different types of fishing vessels are allowed to fish. Zone A, the traditional fishing zone, extends from shore out to 5 nautical miles, and is open only to traditional fishing vessels. Commercial vessels less than 40 GRT are allowed in zone B (5 - 12 nautical miles from shore), while zone C (12 - 30 nautical miles) is open to all vessels less than 70 GRT. According to official statistics, there were 20,845 li censed fisher s in Sabah in 2006 (Anon . , 2006); however, this is considered to be an underestimate due to a large number of unlicensed and migrant fishers (Biusing, 2001). Local small - scale fishers are mainly of Bajau ethnicity, while the large population o f migrant fishers, many of whom reside illegally in Sabah, originate from the southern Philippines and Indonesia. Some of this group are of Bajau background and are employed as crew on large commercial fishing vessels or are engaged in traditional fishing. The number of fishers in Sabah increased rapidly in the mid 1970s to 1980s as refugees fleeing political instability in southern Philippines settled along coastal areas or outer islands of Sabah, and turned to fishing for a livelihood. To the present day, illegal entrants continue to filter into Sabah and live in relative poverty in overcrowded water villages, a situation which has given rise to societal discontent as they have been accused of carrying out crime, dynamite fishing, and stressing coastal res ources (Pilcher and Cabanban, 2000; Anon . , 2008a). Overall, due to its social and political context, Sabahâs traditional fisheries sector faces the marginalization commonly experienced by small - scale fisheries in the region (Pauly, 1997). Nonetheless, th ese fisheries provide the main source of income and meat protein for a large proportion of Sabahâs rural coastal communities (Fisher, 2000; IPMB, 2003; Teh et al. , 2005; Foo et al. , 2006), and reinforce the critical role small - scale fisheries play in suppo rting the food and livelihood needs of coastal communities throughout Southeast Asia (McManus, 1997; Burke et al. , 2002; Loper et al. , 2008). The importance of inshore fisheries to Sabahâs coastal populations is even greater considerin
3 g that Sabah is one o f the poorest stat
g that Sabah is one o f the poorest states in Malaysia (Leete, 2008). Marine fisheries in Malaysia are regulated by the Fisheries Act of 1985, which makes provision for the management, development, and conservation of fisheries resources. Federal development strategies, inclu ding those for fisheries, are announced every five years. Under the 9 th Malaysia Plan for 2006 - 2011, poverty eradication among fishers in Sabah was earmarked as a priority program. Some government program aimed at alleviating poverty include diesel fuel su bsidies for fishers, grants for setting up seaweed and aquaculture operations, and agriculture development schemes (Anon . , 2008b; 2009; Anon . , 2008c). Fisheries catch reconstructions: Islands , Part I, Zeller and Harper 79 The Sabah Fisheries Department is the main agency in charge of managing the stateâs fisheries resources . Its objectives include uplifting the socio - economic status of the fisheries community, managing fishery resources to ensure a reliable supply of fish, increasing capture production, and carrying out fisheries monitoring, research, and development ( www.fishdept.sabah.gov.my/deptfunctions.asp ). Commercial fisheries Following its beginnings in the early 1960s, the prawn trawl fishery quickly became the major commercial fishery in Sabah. Tr awling was first encouraged by the British, then the Sabah government, as a means of generating export revenue amid growing international demand (Mohammad Ariff, 1999). From 12 trawlers in 1962, the fleet grew rapidly to reach over 1000 vessels in 1985 and up to 1400 registered vessels in 2006. At the same time, prawn landings in Sabah increased from 209 t in 1962 to 10,209 t in 1990, but thereafter declined significantly from 6,702 t in 1991 to 2,880 t in 1999, indicating that prawn resources had been expl oited beyond their sustainable limit (Biusing, 2001). Uses for bycatch from prawn trawlers were investigated in the late 1970s (Snell, 1978a). However, it was not until the beginning of the 1990s when so - called âtrashâ fish and bycatch of juvenile or low - value fish that were previously discarded at sea by trawlers were increasingly landed for use in fishmeal processing plants (Biusing, 2001). With this ready market, some trawlers now even make special fishing trips to target âtrashâ fish for fishmeal prod uction. In 2000, there were 8 fishmeal plants in Sabah, each with an average production of about 2,500 t year - 1 (Biusing, 2001). Several fishmeal plants have reportedly faced raw material shortages and have been turning to other countries such as Indonesia for supply (Biusing, 2001) Seine nets (e.g., beach seines) have traditionally been used on a small - scale basis by rural fishers. The commercial purse seine fishery developed in the mid 1980s to catch tuna, anchovies, and other pelagic fish (Biusing 2001 ). The main purse seine fishing grounds are in deeper parts of the EEZ on the west coast of Sabah, and adjacent to Semporna waters in the east coast (Biusing 2001). Some fish processing plants reportedly operated their own purse seiners to obtain raw mater ials (i.e., âtrashâ fish). Small - Scale fisheries Sabahâs small - scale fisheries are concentrated in the inshore area, targeting mainly reef associated and estuarine species (Wood, 2001; Teh et al. , 2005). These multi - species fisheries contribute the main supply of fresh fish for local consumption in coastal villages, with a portion being transported to larger markets in the main urban centers. Certain specialized fisheries, such as those for the live reef food fish trade, bêche - de - mer, and abalone, are ca rried out by small - scale fishers using hook and line, traps, and diving (both free diving and hookah). The high global demand generated for these specific species has led to the rapid decline in the populations of these reef species (Daw et al. , 2002; Choo , 2004; Scales et al. , 2007). The use of destructive fishing techniques such as dynamite and cyanide is still common (Oakley et al.
4 , 1999; Pilcher and Cabanban, 2000; Te
, 1999; Pilcher and Cabanban, 2000; Teh et al. , 2007). This has damaged and destroyed unprotected reefs throughout Sabah (Oak ley et al. , 1999; Pilcher and Cabanban, 2000; Koh et al. , 2002), leading to a low abundance of commercially important fish compared to protected areas (Teh et al. , 2008). The magnitude of small - scale fishing is underestimated in the official statistics, as small - scale landings are not recorded in many fishing villages (Teh et al. , 2007) Fisheries Statistics The first Fisheries Department in present - day Sabah was established in 1948, with the main function of compiling fisheries statistics and performing research. During this time, surveys were carried out at the Sandakan fish market, but these data were not available to us. The Fisheries Department was closed in 1953 and re - organized as a sub - department under the Agricultural Department. Its activities we re confined to freshwater fish culture, as providing additional protein to the rural populationâs diet was seen as a more immediate need than collecting statistical data (Anon . , 1953). Following the closure of the Fisheries Department, there was no governm ent authority responsible for marine fishing in North Borneo. 80 Fisheries catch reconstructions: Islands , Part I , Zeller and Harper Prior to independence in 1963, British colonial reports provided data only on the quantity of exported fisheries commodities. After independence, statistics on marine fisheries landings, the r egistered number of vessels, fishers, and fishing gears has been compiled by the Sabah Fisheries Department. Before 1991, marine fish landings statistics were estimated from fish market surveys, trawler logbooks, fish processing plant reports, and export data. An improved system was introduced in 1991, which used a stratified random sampling approach to estimate landings of selected fishing gears in Sabahâs 16 coastal districts (Biusing, 2001). Sampling occurs at the largest landing sites in each fishing d istrict (between1 to 3 sites are selected). Landings from these sites are then extrapolated to account for all other landing sites in the district (E. Jinuat pers. comm.) 2 . However, this has resulted in the underestimation of small - scale landings (Teh et a l. , 2007). The presence of unlicensed trawlers (Snell, 1978b; Manan, 2003) also indicates that commercial landings are likely underestimated. Furthermore, the official figures for the number of licensed fishers and vessels have not been updated since 1998, due to the lack of funding to carry out the necessary surveys (E. Jinuat, pers comm.) 2 . History of marine resource use in Sabah Maritime culture and trade are an important part of the regionâs history. Archaeological findings suggest that coastal dwell ers were already present and living off the resources of nearshore and ocean environments in the south - eastern district of Semporna some 3,000 years ago (Sather, 1997). By the thirteenth century, there was a thriving maritime trade network that linked Chin a and insular South - East Asia (Tregonning, 1965). North Borneo was part of the powerful Sulu Sultanate, and marine resources from here were collected and delivered back to Jolo, the seat of the Sulu Empire (Tregonning, 1965; Warren, 1971). The Bajau peop le were the main collectors of marine resources (Tregonning, 1965; Warren, 1971). These included fresh and dried fish which were traded in markets (Evans, 1915), as well as high value commodities such as bêche - de - mer, shark fins, mother - of - pearl, tortoise shells, and turtle eggs (Tregonning, 1965; Warren, 1971). Being semi - nomadic sea people, the Bajau moved freely and frequently between the waters of Sabah and the southern Philippines in multi - day fishing trips to harvest marine resources, returning to the ir home moorages to sell or barter their catch (Warren, 1971; Sather, 1984, 1985, 1997). Today, the sea Bajau remain the most marine oriented ethnic group in Sabah. Present - day Sabah was ceded to the British North Borneo
5 Chartered Company in 1881. The er a und
Chartered Company in 1881. The er a under Company rule was marked by agricultural land development and expansion, whereas fisheries were viewed only as a source of protein supply for the population, and little was invested in its development (Mohammad Ariff, 1999). Early British administ rators introduced a boat licensing system to monitor the semi - nomadic fishing population (Sather, 1997). They also encouraged fishers to adopt a settled lifestyle as plantation workers. Thus, the British influenced a transition towards an increasingly mone tized economy, and drew many traditionally nomadic, sea - oriented people towards a settled lifestyle on land. The emphasis on land development led to the arrival of migrant workers, and the demand for fish as a protein source started to increase. Graduall y, a corresponding shift in the composition of Sabahâs marine resource trade occurred. Brche - de - mer, mother of pearl and turtle shells, although still important, did not have the importance they had under Sulu rule. Instead, attention was now centered on d omestic demand for fish to feed a growing local population which was being driven by an influx of plantation laborers. From 1942 to 1945, North Borneo was occupied by Japanese military forces. Economic activity was disrupted as coastal residents retreated inland or, in the case of the Bajau, returned to fishing from the security of small islands in order to avoid Japanese rule along the coast (Mohammad Ariff, 1999). With the defeat of Japan in 1945, North Borneo was placed under British Military Administrat ion, then became a British crown colony in July 1946. 2 E. Jinuat, Fisheries Officer, Sabah Fisheries Department, Kota Kinabalu, Sabah [date received: December 2008]. Fisheries catch reconstructions: Islands , Part I, Zeller and Harper 81 Colonial rule North Borneoâs fishing industry was severely disrupted by World War II, during which many vessels and most of the fishing gear were destroyed (Anon . , 1947). However, fish still remai ned the populationâs staple food after the war (Anon . , 1953). The period under colonial rule was marked by technological change, such as the replacement of paddle and sails with engines. Local materials from the jungle and mangroves that were traditionally used to make fishing gear were replaced with imported, factory produced synthetic materials . By the late 1950s, mechanized fishing boats were popular throughout the coastal districts (Anon . , 1958) . As a result, there was also a change in fishersâ spatial movement, as they were able to go further from shore and exploit new fishing grounds. However, fishing was still done primarily in inshore waters (Anon . , 1958). The fishing industry during this period was still not well organized, and the majority of fis hing was subsistence based and done by independent fishers using traditional gears. Nevertheless, they were able to catch enough fish to meet local demand, as well as to export surplus to neighboring countries (Anon . , 1957; Mohammad Ariff, 1999). While dri ed or salted fish and bêche - de - mer had been the main exports under Company rule, dried shrimp and fish formed the major export commodities under the British administration (Anon . , 1956). During this period, prawn fisheries were carried out by local fishers using tidal prawn nets. Under colonial rule, a small portion of fish was exported fresh for the first time. Domestically, the old system of sea transport was replaced by roads, which along with the emergence of ice production, facilitated the movement of fresh fish to major markets in coastal towns. In urban areas, the fishing industry was primarily run by ethnic Chinese middlemen, who financed fishing gears and boats, as well as cont rolled fish marketing (Anon. , 1955; Mohammad Ariff, 1999). In 1958, the British administration introduced experimental trawling, using a twin beam otter trawl. Widespread trawling started in 1962, marking the beginning of the moder
6 n commercial fisheries sector in Sabah (
n commercial fisheries sector in Sabah (Mohammad Ariff, 1999). Post colonial rule In 1963 North Borneo gained independence from Britain and joined the Malaysian federation, in the process changing its name to Sabah. At this time, fishing was still carried out primarily by small - scale fishers. The new Sabah state government became involved in all asp ects of the fishing industry, including production, marketing, and addressing the poverty of fishing communities (Mohammad Ariff, 1999). A series of fisheries infrastructure projects, low interest loans, and fishing boat and gear subsidy schemes were imple mented (Mohammad Ariff, 1999). Furthermore, a fishers co - operative (Ko - Nelayan) was set up to help with the development of the fishing industry and looking after the interests of fishers (Abdul Mannan, 1982). From 1963 to 2006 the population of Sabah inc reased nearly sixfold , increasing from 504,000 to 3 million. A key driver of Sabahâs population growth has been the arrival of a large number of migrants, many of whom entered Sabah illegally, starting around the late 1960s. Coastal towns and outer islands were settled by refugees fleeing political instability in the southern Philippines during the late 1970s (Piper, 1984). In fishing villages on some islands off the town of Semporna on Sabahâs east coast, up to 90% of households were non - Malaysian citizens (Piper, 1984). Migrants also formed a large portion of the commercial fishery work force (Manan, 2003). METHODS In this study, all fisheries statistics unless stated otherwise were extracted from the Malaysian Department of Fisheries Annual Reports (a vailable at www.dof.gov.my/v2/perangkaan.htm ). Data were available from 1965 to 2006; however, the reporting of data was not consistent throughout the years, with coarser data available in the earlier years. Note that from 1986 onwards, fisheries statistics for Labuan, an island within Sabah state waters, was reported separately from Sabah. However, in this study, reported statistics are inclusive of Labuan to make it comparable with statistics prior t o 1986. 82 Fisheries catch reconstructions: Islands , Part I , Zeller and Harper In Sabah, the presence of large numbers of unlicensed vessels and fishers has been a persistent problem for many years (Wong, 1982; Anon . , 1991; Mohammad Ariff, 1999; Biusing, 2001). The catch reconstruction takes this issue into account by expli citly incorporating unlicensed vessels and fishers to estimate the catch for Sabahâs commercial and traditional fishery, respectively. Due to the more organized nature of the commercial fishery, we assumed that the number of licensed vessels was a good ind icator to estimate number of unlicensed vessels for reconstructing total commercial catches. On the other hand, the traditional small - scale sector lacks any formal organization. Therefore, we based the reconstruction of traditional catches on the estimated number of traditional fishers in Sabah, in order to reflect the widespread, scattered nature of the fishery. Commercial fisheries Prawn trawlers Number of trawlers Trawling was introduced to Sabah in 1958 (Anon . , 1958), but only became widespread in the 1960s. The time series of reported trawl landings started in 1962, while the number of unlicensed trawlers was reported for 3 time periods (Table 1). We assumed the ratio of registered to unlicensed trawl vessels changed linearly between the three tim e periods, starting with zero unlicensed vessels in 1958. Table 1 . Available data sources for estimating the ratio of licensed to unlicensed trawlers in Sabah. Year No. registered trawlers No. unregistered trawlers Ratio (unregistered/registered) Source 1976 342 573 1.58 Snell (1978b) 1979 594 206 0.35 Abdul Mannan (1982) 2003 682 a 550 a 0.81 Manan (2003) a These numbers are based on observation at Sandakan, the major port for trawlers in Sabah. We applied this ratio to the number of licensed trawlers for the whole of
7 Sabah. The ratio of licensed to unl
Sabah. The ratio of licensed to unlicensed trawlers from these three time periods was applied to the number of licensed trawlers reported each year to obtain estimated numbers of unlicensed vessels (Table 2). However, in 1991, a change in the statistical recording system used by the Sabah Fisheries Department led to data on licensed vessels pre - and post - 1991 being incompatible (Biusing, 2001). Specifically, data recorded after 1991 showed a substantial increase due to better coverage of landing areas. As a result, the number of trawlers spiked by over 80% in 1991, increasing from 1046 vessels in 1990 to 1834 in 1991. Furthermore, it appears that the number of licensed vessels was not updated between 1998 and 2005, remaining constant at 1 422 vessels for this period. To minimize these data effects, we did two sets of interpolations. First, we smoothed the number of vessels between 1985 (1054 vessels) and 1998 (1422 vessels). Then, to account for the lack of updated records, we interpolated between 1999 (1422 vessels) and 2006 (1200 vessels; Table 2). Both these modifications to the number of reported licensed vessels is presented as v(smoothed ) in Table 2. Catch rate for trawlers Total catch rates (i.e., inclusive of prawns and fish) for trawlers in Sabah were available for 1962, 1976, and 1994. In 1962, an average catch rate of 35 katis hr - 1 (21kg hr - 1 ) was reported by Mohammad Ariff (1999). In 1976, a study on bycatch in the shrimp trawl fishery was undertaken by the Sabah Fisheries Depa rtment, in which the catch from commercial trawlers was analyzed. The average catch rates recorded during the survey trips were 121.1 kg hr - 1 during the peak fishing months, 36 kg hr - 1 for the low fishing months, and 63 kg hr - 1 during the medium fishing mo nths (Snell 1978b). We used the medium catch rate for our estimate. A survey on technical efficiency of the trawl fishery in Peninsular Malaysia found that the average catch rate for a commercial trawler was 48 kg hr - 1 in 1994 (Viswanathan et al. , 2000). A s we could not find commercial catch rate data for Sabah in this period, we used that rate from Peninsular Malaysia to represent Sabahâs catch rate in 1994. From 1962 to 1994, catch rates were assumed to increase or decrease linearly between the anchor yea rs of 1962, 1976, and 1994. We applied a constant catch rate of 48 kg hr - 1 from 1994 to 2006. Fisheries catch reconstructions: Islands , Part I, Zeller and Harper 83 Table 2 . Reported licensed [ v licensed ], adjusted licensed [ v interpolate ], and estimated unlicensed number of trawlers, as well as trawl catch rates used to es timate total catch for the trawl fishery for Sabah. Year No. of reported trawlers v licensed No. of trawlers with interpolation v interpolate No. of unlicensed trawlers v unlicensed Total estimated no. of trawlers Catch rate (kgâhr - 1 ) 1962 12 12 4 16 21.0 a 1963 53 53 23 76 24.0 1964 86 86 46 132 27.0 1965 135 135 84 219 30.0 1966 152 152 108 260 33.0 1967 221 221 176 397 36.0 1968 311 311 275 586 39.0 1969 312 312 303 615 42.0 1970 294 294 312 606 45.0 1971 301 301 346 647 48.0 1972 334 334 413 7 47 51.0 1973 324 324 430 754 54.0 1974 359 359 508 867 57.0 1975 322 322 484 806 60.0 1976 360 360 573 933 63.0 b 1977 525 525 618 1143 62.2 1978 536 536 408 944 61.3 1979 594 594 206 800 60.5 1980 516 516 189 705 59.7 1981 620 620 240 860 58.8 19 82 444 444 181 625 58.0 1983 789 789 337 1126 57.2 1984 908 908 405 1313 56.3 1985 1054 1054 492 1546 55.5 1986 856 1082 526 1609 54.7 1987 1100 1111 562 1673 53.8 1988 972 1139 599 1738 53.0 1989 1036 1167 637 1805 52.2 1990 1046 1196 677 1872 51. 3 1991 1834 1224 717 1941 50.5 1992
8 1578 1252 759 2011 49.7 199
1578 1252 759 2011 49.7 1993 1560 1280 801 2082 48.8 1994 1419 1309 845 2154 48.0 c 1995 1419 1337 890 2227 48.0 1996 1414 1365 936 2302 48.0 1997 1414 1394 983 2377 48.0 1998 1422 1422 1032 2454 48.0 1999 1422 1 394 1039 2434 48.0 2000 1422 1367 1046 2412 48.0 2001 1422 1339 1051 2390 48.0 2002 1422 1311 1056 2367 48.0 2003 1422 1283 1033 2317 48.0 2004 1422 1256 1011 2267 48.0 2005 1422 1228 989 2216 48.0 2006 1200 1220 966 2166 48.0 Sources: a Mohammad Ariff (1999); b Snell (1978b); c Viswanathan et al. (2000) 84 Fisheries catch reconstructions: Islands , Part I , Zeller and Harper Trawl fishing effort An average trawl fishing effort of 1608 hrs vessel - 1 â yr - 1 was estimated based on information from Mohammad Ariff (1999) for 1962, while Snell (1978b) reported an annual effort of 1214 hrsâvessel - 1 âyear - 1 for 1976. The former effort value was applied to 1962, and linearly increased to 1214 hrsâvessel - 1 âyear - 1 in 1976. A constant effort of 1214 hrsâvessel - 1 âyear - 1 was applied to all years after, from 1976 to 2006. Catch for trawl fishery 1962 - 2006 The total annual catch for trawlers ( C tr ) was calculated as C tr = v â r â f where v is the total number of trawl vessels (i.e., v interpolate + v unlicensed , Table 2), r the annual catch rate, and f the average annual fishing effort per vessel. Trawler discards and bycatch Beginning in the 1990s, co - called âtrashâ fish and other trawler bycatch was increasingly l anded for use in fishmeal processing plants (Biusing, 2001). This was not the case prior to 1990, which implies that from 1962 to 1990, a substantial amount of catch was discarded at sea. A breakdown of a typical trawl catch was provided in Snellâs (1978b) study on bycatch in the prawn - trawl fishery (Table 3). To estimate the quantity of discarded fish from 1962 - 1990, we multiplied the âunmarketable fishâ percentage (64%) by the estimated annual trawl catches. Biusing (2001) reported that there is currently a shortage of âtrashâ fish for fishmeal production; thus, it is reasonable to assume that for recent years, no discarding is done by trawlers. Purse seiners Number of purse seine vessels The purse seine fisheries in Sabah started in the late 1980s. We did not find any reports documenting unlicensed purse seine vessels; however, we assumed that unlicensed vessels did exist, since the incentives driving unlicensed vessels in the trawl sector are likely to operate in the purse seine fisheries as well. To estimate the number of unlicensed purse seine vessels, we first calculated the average (across all years) ratio of licensed: unlicensed vessels in the trawl fishery. We then applied this ratio to the yearly number of licensed purse seine vessels to estimat e the number of unlicensed purse seine vessels per year. Catch rate for purse seine vessels The only catch rate information specific to purse seiners in Sabah was from an experimental fishing survey carried out in 1988, during which a catch rate of 14 t per haul was recorded (Chee, 1995). We chose not to use this catch rate as it might not be representative of normal commercial fishing operations. Instead, we used a catch rate of 180.67 tâboat - 1 year - 1 that was recorded for purse seine vessels in Peninsu lar Malaysia in 1983 (Hotta and Low, 1985). This rate was applied to the assumed start year of 1987 for purse seine vessels in Sabah. To account for changes in catch rate over time, we assumed that the catch rate changed in proportion to the annual change in recorded landings per vessel. Since 1998, the number of recorded purse seine vessels has remained the same in the national statistics. Total Commercial catch Total commercial catch was calculated by summing total catches (licensed + unlicensed vessel s) from t
9 he trawl and purse seine fisheries from
he trawl and purse seine fisheries from 1962 to 2006. Note that this is inclusive of discards from 1962 to 1990. Table 3 . Percentage breakdown of a commercial trawl catch in Sabah (Snell 1978b) Item % of catch a Prawn 6.0 Marketable fish 24.9 Unmarketable fish 63.9 a Averaged from 3 different commercial vessels which operated during different months of the year. Fisheries catch reconstructions: Islands , Part I, Zeller and Harper 85 Traditional fisheries Estimation of traditional catches is based on the number of traditional small - scale fishers. As mentioned ear lier, the number of fishers recorded in the official statistics is considered an underestimate. The Fisheries Department does not know how many migrant fishers reside in Sabah, but they could number in the thousands (Biusing, 2001). We therefore estimate t he number of traditional fishers who fish for both subsistence and artisanal purposes in two steps. First, we estimate the number of potential fishers (i.e., both commercial and traditional fishers) from the general population. This comprises local fishers and non - Malaysian (migrant) fishers, many of whom entered Sabah illegally from Indonesia and the Philippines. Secondly, we estimate the number of traditional fishers from this larger fisher population as detailed below. Estimating the population of pote ntial fishers Locals To account for local fishers, we assumed that they were all Bajaus. As mentioned earlier, Bajaus traditionally made a living from fishing, and are the primary marine resource users and fishers in present - day Sabah (Tregonning, 1965; Piper, 1984; Sather, 1997). Besides Bajaus, other ethnic groups such as Suluks and Brunei Malays may also engage in fishing (Biusing, 2001). However, their participation is lower than the Bajaus, and by including only Bajaus we make our estimate conservati ve. The number of Bajaus as a proportion of Sabahâs total population has remained relatively constant from 1950 to the present, varying between 11 to 15% (Lee, 1968; Anon. , 2001; Leete, 2008). We used an average of 13% for all years to derive the number of Bajaus from Sabahâs population from 1950 - 2006 ( p B , see Estimate 1 below). Migrants There is a large migran t population in Sabah (Anon. , 1990a; Sam, 2008). Constant arrivals and deportation make it difficult to estimate this population. Our estimate was based on available data in 1990 and 2005, when illegal immigrants were estimated to make up 30% and 25% of Sabahâs total pop ulation, respectively (Anon. , 1990b; Leete, 2008; Sam, 2008). Migration between Sabah and neighboring countries has occurred for ce nturies. However, for the period of interest to us (1950 - 2006), the wave of immigrants started to arrive in Sabah in the late 1960s, intensifying during the South Philippine Moro insurgency during the 1970s. Thus, we assumed that arrivals started in 1968, and that the percentage of immigrants as a proportion of Sabahâs population increased linearly from 0 in 1967 to 30% in 1990. Thereafter, we also assumed that the proportion decreased linearly to 25% in 2005 and remained constant in 2006. Estimating numb er of traditional fishers Fishers in Sabah were predominantly âtraditionalâ until commercial fisheries started in the 1960s. Therefore, the estimated number of fishers was assumed to be all traditional fishers for the period 1950 - 1965. Biusing (2001) repo rted that from 1991 - 1999, an average of 78.5% of local fishers were traditional fishers, while 40.7% of non - Malaysian fishers (immigrants) were traditional fishers. This breakdown was applied to the estimated number of local and immigrant fishers for the p eriod 1991 - 2006. For the period 1966 - 1990, we linearly decreased the proportion of traditional fishers from 100% in 1965 to 78.5% in 1991. We did likewise for non - Malaysian fishers for the period 1968 to 2006. We estimated the number of traditional fishe rs using three different methods detailed below, and used an average of the t
10 hree estimates as the basis to calculate
hree estimates as the basis to calculate traditional catch. Estimate 1 T he majority of Bajau and non - Malaysian residents reside in Sabahâs coastal districts (Anon . , 2001). We assumed that fishing villages were all located in rural coastal areas, so that it was reasonable to base 86 Fisheries catch reconstructions: Islands , Part I , Zeller and Harper the number of Bajau traditional fishers (F TB ) on Sabahâs rural population as : F TB = p B ârâ p hh â v f â f hh â t B, where p B is the population of Bajaus in Sabah (see estimation of local fishers above), r is the proportion of population living in rural areas, p hh is the average household size, v f is the proportion of households that fish in a v illage, f hh is the number of fishers per household, and t B is the proportion of Bajau fishers who are traditional fishers. In 1951, 10% of the population was urban, while in 1960 15% of the population was urban, of which indigenous people comprised 17% ( Jones, 1966). In other words, only 2.6% of the indigenous population lived in urban areas in 1960. Thus, we assumed that from 1950 - 1960 all indigenous people, including the Bajau, were rural residents (i.e., r = 1.0). From 1960 onwards we linearly decrease d the rural population to two further anchor points - in 1970, 80% of the population was rural ( r = 0.8) and in 2005, 50% ( r = 0.5) of the population was rural (Leete, 2008). We left the 2006 rural population the same as that in 2005. Data on average house hold sizes ( p hh ) in Sabah were available for the following periods: 1960 = 5; 1970 = 5.5; 1980= 5.4 (Leete and Kwok, 1986); 2008=5 (Anon . , 2008d). These values were applied to the following periods: 1950 - 1969, p hh = 5; 1970 - 1979, p hh = 5.4; 1980 - 1999, p hh = 5.4; and 2000 - 2006, p hh = 5. The values for the proportion of households that fish in a village ( v f ) were based on a study of a Bajau fishing village in Semporna during the 1960s and 1970s (Sather, 1997). In 1965, Sather (1997) found that 98% of villa ge households still depended on fishing for all, or part of their incomes. By 1979, the proportion of fishing dependent households had fallen to 25%. More recent surveys done since the late 1990s found that fishing was still the primary livelihood for the majority of people in coastal villages (Piper, 1984; Fisher, 2000; Wood, 2001; Teh et al. , 2005; Teh et al. , 2007), with fishing households making up from 20% (Teh, unpublished data) to between 80 to 90% (Almada - Villela, 1997) of village households. Base d on this information, we assumed that in 1950 almost all ( v f = 0.98) households in coastal villages fished. This was linearly decreased to 25% in 1979 ( v f = 0.25), and to a conservative value of 20% ( v f = 0.20) in 2004. The proportion was kept constant fr om 2004 - 2006. A socio - economic survey of small - scale fishers in the early 1980s found that there were on average 1.4 fishers per household (Abdul Mannan, 1982). We applied this value ( f hh = 1.4) to all years to obtain the number of Bajau fishers. Finally , we multiplied the number of Bajau fishers by t B , the proportion of Bajau fishers who are traditional fishers (1950 - 1965: t B = 1.0; 1966 - 1990: interpolated t B = 1.0 - � 0.78; 1991 - 2006: t B = 0.78), to obtain the number of traditional Bajau fishers in each year. The number of non - Malaysian (migrant) traditional fishers (F TN ) was calculated as: F TN = p N â f N â t N where p N i s the population of non - Malaysian citizens in Sabah, f N is the proportion of non - Malaysian citizens who are fishers, and t N is the propor tion of non - Malaysian fishers who are traditional fishers. Hassan (1978) found that 10% of migrants originating from Tawi - Tawi Island in the Philippines, a common origin for many of Sabahâs migrants, took up fishing as a livelihood after arriving in Sabah . Therefore, we applied 10% ( f N = 0.1) to the population of non - Malaysians to
11 obtain the number of non - Malaysian fi
obtain the number of non - Malaysian fishers. We used the same proportion for all years up to 2006. The proportion of non - Malaysian fishers who are traditional fishers ( t N =0.40, s ee above) was used to determine the number of non - Malaysian traditional fishers. Estimate 2 The anchor point for this estimate was 1891, the year in which a population census indicated there were only 910 fishermen (8% of the population) in former Britis h Borneo (Mohammad Ariff, 1999). To carry forward this estimate, we made the assumption that the proportion of fishers to total population remained stable through time. This may be a strong assumption given that new industries and economic opportunities wo uld have attracted fishers to other occupations. However, a detailed study of a fishing community showed that when local fishers turned to more stable and paid employment in other resource sectors starting in the late 1960s and early 1970s, their places we re taken by the arrival of migrants (Sather, 1985, 1997). Moreover, fishing was, and still is, a fall back activity which people return to. It is Fisheries catch reconstructions: Islands , Part I, Zeller and Harper 87 therefore likely that on the whole, the proportion of Sabahâs population that is involved in fishing has remai ned approximately the same. To carry our estimate through time, we simply applied the percentage of fishers (8%) to our defined fisher population: from 1950 to 1968 this percentage was applied to the population of Bajaus. From 1968 onwards, the percentage was applied to the population of Bajaus plus non - Malaysian citizens. This was then multiplied by t B and t N to obtain the number of traditional Bajau and non - Malaysian fishers. Estimate 3 Due to the dispersed and relatively isolated nature of Sabahâs sm all - scale fisheries, many fishers do not register for licenses. According to a fisheries official, the number of unlicensed fishers made up an additional 30% from the number of licensed fishers recorded in the fisheries statistics (E. Jinuat, pers. comm.) 2 . Further, the extra 30% consisted of small - scale fishers, both locals and non - Malaysians. We assume that this under - reporting has been occurring since Malaysian independence, so that from 1963 to 1998, we increased the annual number of licensed traditiona l fishers by 30% to account for unlicensed fishers. From 1998 to 2006, this approach could not be used because statistics on the number of fishers had not been updated and recorded the same number of fishers (20,845, or 8,091 traditional fishers) each year . However, the number of traditional fishers had in fact been increasing by around 4,000 annually (E. Jinuat, pers. comm.) 2 . Therefore, for 1998 - 2006, we added 4,000 fishers to each subsequent year to obtain the total number of traditional fishers (inclusi ve of unlicensed fishers). Traditional catch rates We estimated catch rates for 3 periods: 1950 - 1969, 1970 - 1999, and 2000 - 2006. Each period was chosen to roughly coincide with the prevailing economic conditions which affected small - scale fishers. 1950 - 1969: An annual catch rate of 3.09 t fisher - 1 year - 1 was used. This catch rate was based on an anthropological study done in a Semporna Bajau fishing community in 1965 by Sather (1984, 1997). We derived a catch rate based on Satherâs qualitative descripti on of the proportion of a catch that was sold after each multi - day fishing trip, the price of fish in the Semporna market, and the frequency and duration of long fishing trips. In addition, we added a subsistence catch of 2 kg â fisher - 1 â d - 1 based on Teh et al. (2007) for the periods that Bajau fishers did not go on extended fishing trips. It is likely that 2 kg is a conservative estimate of the subsistence catch rate for this period, as sharing fish with family and friends was still a common practice, but no t as important during the time of the Teh et al. (2007) study. Historically, all Bajau Laut in Semporna lived permanently afloat in small sailing vess
12 els, and fished principally around the
els, and fished principally around the Semporna area (Sather, 1984; 1985). However, families frequently we nt beyond Sabah to the southern Philippine Sibutu island cluster to fish and visit friends or family (Sather, 1984). Thus, a portion of their catch was likely not from within Sabah waters. To account for this, we assumed that 15% of catches in this period originated from outside Sabah. This is reasonable since the coral reefs around Semporna, notably the Ligitan reefs, were described as the major fishing grounds for Semporna Bajau Laut (Sather, 1984; 1985). The majority of boat dwelling Bajau Laut familie s settled permanently on land by the 1960s (Sather, 1985; 1997), thus were not likely to make extended trips to the Philippines after giving up their boat dwelling lifestyle. Figure 2 . Breakdown of commercial and traditional landings by fish groups, averaged from 1991 - 1996, and 2002 - 2006. 88 Fisheries catch reconstructions: Islands , Part I , Zeller and Harper Consequently, we used a catch rate of 2.6 t fisher - 1 â year - 1 (i.e., 85% of 3.09 ca lculated above) starting in 1950. This was linearly increased to a catch rate of 5 t â fisher - 1 â year - 1 in 1970 (see below). 1970 - 1999: There were no readily available catch rate data for this period. Demand for fish intensified starting in the 1970s due to the construction of trunk roads, which improved the transportation of fish from rural areas to urban markets. At the same time, an influx of immigrants arrived in Sabah during this period. As Sabahâs population, and therefore the fisher population, was st ill low in the early 1970s, we assume d that fishersâ catch rates increased to meet the extra demand. As such, we assumed that the 1970 - 1989 catch rate was 1.3 t higher (i.e., 5 t â fisher - 1 â year - 1 ) than the subsequent rate from 1990 - 2006 (3.68 t â fisher - 1 â year - 1 ). A catch rate of 5 t â fisher - 1 â year - 1 was applied from 1970 - 1980, then starting in 1981, the catch rate was linearly decreased to 3.68 t â fisher - 1 â year - 1 in 2000. Interviews with small - scale fishers in Pulau Banggi, northern Sabah in 2004/2005 indicated that the 1980s were good fishing years, with individual catch rates 3 to 4 times higher compared to the 2000s. Thus, we remained conservative by not doubling the 2000 - 2006 cat ch rate of 3.68 t â fisher - 1 â year - 1 . Moreover, most of the interviewed fishers indicated that catches started to decline in 2000 (Teh et al. , 2007). Again, we made our estimate conservative by starting the decline of the âgoodâ fishing period in 1981. 2000 - 2006: A catch ra te of 3.68 t â fisher - 1 â year - 1 was applied to this period. This catch rate was based on the average catch rate recorded for small - scale reef fisheries in Pulau Banggi, an island group off northern Sabah (Teh et al. 2007). Total traditional catch Total ann ual traditional catch (C trad ) was calculated as: C trad = x â r trad where x is the number of fishers, and r trad is the individual catch rate. Catch composition of Sabahâs marine fisheries landings The taxonomic breakdown of annual marine landings was obtained for 1965 to 2006 from annual fisheries reports. A breakdown according to gear was available for 1991 to 1996, and 2002 to 2006. The average composition for commercial (trawl and purse seine) and traditional gears (gillnets, seine nets, hook and line, traps, hand collection, and spears) is presented in Figure 2. The crustaceans group is made up of prawns, lobsters, an d crabs, with prawns accounting for the bulk of the reported data. As the reconstructed catches involved the same gear types as those in recorded landings, it was assumed reasonable to apply the same taxonomic breakdown observed from landings (1965 - 2006) to the yearly reconstructed catches. Sabahâs fisheries were mostly small - scale traditional before 1965; thus, the composition of reconstructed catches from 1950 to 1964 were assumed to
13 resemble the traditional breakdown onl
resemble the traditional breakdown only (Figure 2). It should be note d that in the north and east coasts of Sabah, subsistence fishing targets mainly reef associated species (Piper, 1984; Wood, 2001; Teh et al. , 2005; 2007), while more small pelagics are caught in the west coast. Piper (1984) reported that a spear gun catch consisted of 1 large trigger fish (Balistidae), 1 butterflyfish (Chaetodontidae), 1 sweetlip (Haemulidae), damselfish (Pomacentridae), groupers (Serranidae), angelfish (Pomacanthidae), 1 octopus, tusk fish (Labridae), and rabbit fish (Siganidae). Compare d to more recent reports on subsistence fishing (Wood, 2001; Teh et al. , 2005; 2007), there appears to have been little change in the type of demersal reef fish caught in the past 20 years. Table 4 . Breakdown of trawl discards from Snell (1978b) Taxon % of discards Ariidae 11.3 Clupeidae 4.4 Engraulidae 1.0 Paralichthyidae 3.5 Gerreidae 1.5 Lagocephalidae 4.2 Leiognathidae 23.2 Mullidae 3.3 Nemipteridae 5.1 Platycephalidae 7.2 Pomadasyidae 7.9 Dasyatidae and Carcharhinidae 6.7 Sciae nidae 8.1 Synodontidae 4.8 Theraponidae 2.3 Trichiuridae 15.4 Others 15.5 Fisheries catch reconstructions: Islands , Part I, Zeller and Harper 89 Table 5 . Estimated number of traditional fishers (1950 - 2006) com pared to reported number of traditional fishers (1987 - 2006) for Sabah. Year Estimated trawl catch Estimated purse seine catch Estimated commercial landings Reported commercial landings 1962 549 - 549 - 1963 2899 - 2899 - 1964 5524 - 5524 - 1965 10032 - 10032 - 1966 12910 - 12910 - 1967 21238 - 21238 - 1968 33527 - 33527 - 1969 37454 - 37454 - 1970 39052 - 39052 26009 1971 43993 - 43993 26721 1972 53449 - 53449 27127 1973 56521 - 56521 31192 1974 68003 - 68003 32309 1975 65995 - 65995 33020 1 976 71358 - 71358 30700 1977 86246 - 86246 34900 1978 70311 - 70311 40100 1979 58758 - 58758 40200 1980 51084 - 51084 33300 1981 61405 2195 63601 42008 1982 43974 7155 51129 37592 1983 78113 12114 90227 30116 1984 89821 17073 106895 30258 1985 104 137 22033 126170 27873 1986 106760 26992 133752 20672 1987 109329 31951 141281 25496 1988 111841 51220 163061 19123 1989 114292 37623 151915 20742 1990 116679 38172 154851 22361 1991 118998 78577 197575 45321 1992 121247 81950 203197 61856 1993 123 421 100963 224383 62613 1994 125517 103363 228880 77504 1995 129784 126867 256651 85278 1996 134118 98171 232289 91014 1997 138518 65420 203938 93018 1998 142983 93471 236454 119804 1999 141812 93851 235663 133434 2000 140577 103725 244301 137694 2 001 139277 93041 232319 120877 2002 137913 99040 236953 114404 2003 134994 92374 227368 104703 2004 132075 102182 234256 123210 2005 129155 118447 247602 129730 2006 126236 101648 227884 116165 90 Fisheries catch reconstructions: Islands , Part I , Zeller and Harper Prior to 1991, bycatch from trawlers was not landed an d thus the taxonomic breakdown of these discards was not recorded. Here, the breakdown of discards is based on a study of trawler bycatch conducted by Snell (1978b) (Table 4). Ninety five percent of bycatch was demersal fish (Snell, 1978b), with the remain der being small pelagics. Discarded fish were either too small for human consumption, poisonous, or had no consumer demand (Snell, 1978b). Trawler bycatch estimated for 1962 - 1990 was thus allocated to the âtrash fishâ and miscellaneous mixed fish category. The discarded species from Snellâs study are consistent with another report, which stated that low value demersal fish which were not landed prio
14 r to 1991 included lizard fish ( Saurid
r to 1991 included lizard fish ( Saurida spp.), goat fish (Mullidae), juvenile threadfin bream ( Nemipterus spp.), slipmouths (Leiognathidae), and flat fish (Plotosidae) (Biusing, 2001). From 1991 to 2006, so - called âtrashâ fish comprised the largest proportion (19%) of trawl landings. On the other hand, âtrashâ fish only made up a minor (2%) part of purse seine landings. RESULTS Commercial sector Catches The reconstructed catch for the commercial sector (trawl and purse seine) totaled 5.6 million t for the period 1962 to 2006, with trawl and purse seine catches accounting for 3.8 million and 1.8 million t, respectively. Trawl landings data were available from 1970 to 2006; prior to that, only landings of prawns was reported (1962 to 1970). Purse seine landings data were available from 1987 to 2006. For the period 1970 - 2006, total reported commercial landings was 2.25 million t, whereas reconstructed catches for the same period totaled 5.52 million t, or 250% higher than reported landings (Table 5). Incorporating unlicensed vessels and discards resulted in the reconstructed trawl catch trend differing from r ecorded trawl landings for the 1980 - 1990 Figure 3 . Reconstructed trawl catches and recorded trawl landings 1962 - 2006. Note that recorded landings from 19 62 to 1969 show prawn landings only. Figure 4 . Reconstructed purse seine catches 1981 - 2006 and recorded landings 1987 - 2006 Figure 5 . Reconstructed trawl catches showing the amount of discards 1962 - 2006. Fisheries catch reconstructions: Islands , Part I, Zeller and Harper 91 period . While both sets of data increased from the 1960s to 1980, the reconstructed catches dipped in the early 1980s, thereafter inc reasing again until reaching a peak in the late 1990s/early 2000. In contrast, the recorded landings showed the similar dip in the late 1980s, then followed the same path of increase until peaking in the late 1990s (Fig ure 3). The reconstructed purse sei ne catch trend was more consistent with recorded landings. Both showed an increasing trend since data for the fishery started to be reported in 1987. Overall, reconstructed purse seine catches were almost double the recorded landings (Figure 4). Discards We estimated that from 1962 to 1990, an average of 33,741 t of fish were discarded by licensed and unlicensed trawlers annually (Fig ure 5). The sum of estimated discards from 1965 to 1990 was almost equal to the total reported landings for the same period (972,755 t discards vs. 1.03 million t reported landings). Traditional sector N umber of traditional fishers We had access to data on the number of reported fishers from 1966 to 2006 (commercial and traditional), and traditional fishers from 1988 - 2006. We developed estimates for the number of traditional fishers from 1950 to 2006 (Table 6). On average, the estimates presented for 1988 to 2006 were 2.5 times higher than the number of traditional fishermen reported in the fisheries statistics. Note that s ince 1998, official statistics on the number of fishers have not been updated, and has remained at 8,091 fishers. Catches We had reported traditional landings data for 1982 to 2006. The estimated traditional catches showed a generally increasing trend f rom 1950 to 2006, totaling 4 million t for the period. On the other hand, recorded landings were fluctuating and unstable for the period 1982 to 2006 (Fig.6). The sum of all reconstructed catches from 1982 to 2006 was double that of recorded landings for t he same period. Considering the evidence of declining catch rates for the traditional sector, this increasing total catch trend reflects the Table 6 . Estimated number of traditional fishers (1950 - 2006) compared to reported number of traditional fishers (1987 - 2006) for Sabah. Year Estimated no. of traditional fishers Reported no. of total fishers Repor ted no. of traditional fishers 1950 9531 - - 1951 9008 - -
15 1952 9088 - - 1953 9262 -
1952 9088 - - 1953 9262 - - 1954 9310 - - 1955 9377 - - 1956 9491 - - 1957 9604 - - 1958 9780 - - 1959 9916 - - 1960 10264 - - 1961 10328 - - 1962 10364 - - 1963 10373 - - 1964 10451 - - 1965 10518 - - 1966 9894 9800 - 1967 9775 9500 - 1968 9717 8950 - 1969 9701 9050 - 1970 9714 9000 - 1971 9842 9000 - 1972 9702 8900 - 1973 9883 11147 - 1974 10535 11182 - 1975 10772 11200 - 1976 11161 11000 - 1977 11491 11180 - 1978 1184 6 16978 - 1979 12047 17610 - 1980 12524 18000 - 1981 12242 18450 - 1982 12946 19850 - 1983 13627 19900 - 1984 14390 19900 - 1985 15177 20500 - 1986 16012 20500 - 1987 16906 17730 - 1988 17753 17730 9679 1989 18879 18250 9790 1990 19765 16028 90 15 1991 20657 16133 9015 1992 23599 17209 10931 1993 24902 18410 11954 1994 27015 19819 13345 1995 27746 19819 13355 1996 29625 20415 14070 1997 30382 20415 14070 1998 31835 20845 9102 1999 35563 20845 9102 2000 32793 20845 9102 2001 35328 20845 9102 2002 35121 20845 9102 2003 36317 20845 9102 2004 37273 20845 9102 2005 40912 20845 9102 2006 41940 20845 9102 92 Fisheries catch reconstructions: Islands , Part I , Zeller and Harper substantial rise in entrants into Sabahâs fisheries. Total catches The reconstructed catch time series from 1 950 to 2006 summed to 9.7 million t. Compared to landings data reported in the Annual Fisheries Statistics from 1965 to 2006, the reconstructed c atch was on average 220% larger (Figure 7a). Since 1991, official statistics reported landings ranging between 115,000 and 218,000 tâyear - 1 , whereas the reconstructed catch totals indicated catches of between 284,000 and 398,000 tâyear - 1 . Overall, the reconstructed traditional catches showed a more stable trend, gradually increasing through time. On the other hand, the commercial catches fluctuated a lot more (Fig ure 7b). Catch composition A taxonomic breakdown for recorded landings was available from 1965 to 2006. In this period, the inclusion of trawler discards in the catch reconstruction resulted in a substant ially different breakdown when compared to the fisheries statistics. The reconstructed catch composition for 1950 - 2006 (inclusive of both traditional and commercial sectors) showed that the âtrash fishâ and miscellaneous mixed fish group made up, on aver age, 27% of the catch, whereas the fisheries statistics recorded an average of 5% (Fig ure 8). DISCUSSION The historical reconstruction presented here spans two periods in Sabahâs history. Prior to independence in 1963 , the British Colonial Administrat ion recorded only exported fisheries commodities, which consisted primarily of salted fish and dried prawns. Our reconstructed data suggest that the sum of total catches from 1950 to 1962 is around 421,200 t. British Colonial reports recorded a sum of roug hly 16,438 t of exported fisheries products for th is period (note that no data were recorded in 1953 and 1954). Accounting for the loss in weight of Figure 7 . Total reconstructed catch for Sabah, 1950 - 2006 : a) as compared to recorded landings, and b) represented as commercial and traditional components. Figure 6. Reconstructed traditional catches for 1950 - 2006 and reported landings for 1982 - 2006. Figure 8 . Breakdown of reconstructed catch and reported landings by fish groups. Fisheries catch reconstructions: Islands , Part I, Zeller and Harper 93 the dried products, this would be approximately equivalent to 288,000 t of fresh fish. In the post - colonia l period, the reconstruction suggests that catches from Sabahâs waters are on average 2.2 times higher than those reported
16 in the official Malaysian statistics fro
in the official Malaysian statistics from 1965 to 2006. This falls in the lower end of findings from other catch reconstruction effor ts, where differences of 1.7 fold and up to 17 fold have been found (Zeller et al. , 2006; Jacquet and Zeller, 2007; Zeller et al. , 2007). The reconstructed estimates presented here suggest that Sabahâs total marine fisheries catches have been on an incre asing trend for the 56 year period from 1950 to 2006. This matches the trend from official statistics, although magnitudes differ substantially throughout time. Clearly missing also in the reconstructed data was the steep increases in reported landings in 1990 - 1991 that were due to the combined effects of: a) a change to an improved methodology used for sampling fisheries landings, and b) the landing of so - called âtrashâ fish which were previously discarded prior to finding a market in fishmeal production i n the early 1990s (Biusing, 2001). These changes and artifacts are more properly accounted for in the reconstructed estimates. Reconstructed catches from 1965 to 1990 are on average 3.4 times higher than reported landings, compared to an almost two fold di fference from 1991 to 2006. This may indicate that Sabahâs fisheries monitoring system has improved; nevertheless, the current system still does not account for a substantial amount of small - scale fisheries which take place along Sabahâs inshore waters. The proliferation of small - scale fishing in Sabahâs coastal communities, combined with the inadequate coverage of fishing villages by the Fisheries Department, necessitated that we build our estimation of traditional fishers on general demographic statist ics, rather than on the reported number of traditional fishers or vessels. Our approach estimated that the number of traditional small - scale fishers was 2.5 times higher than that reported in the fisheries statistics. To our knowledge, our study is the fi rst to explicitly incorporate both local and immigrant fishing effort into an estimate of Sabahâs small - scale fisheries catch. Nevertheless, even our estimates may be underestimates, as our local fisher population is based primarily on the population of Ba jaus, who have the traditional role of being fishers. We have not included other ethnic groups such as Suluks, who also engage in some fishing, but to a lesser extent than Bajaus. Thus, our estimate presents a lower limit on the number of traditional fishe rs and fish catch volume. Nonetheless, it reflects the substantial increase in Sabahâs population over the past 2 decades. In particular, the difference between registered and estimated fishers starts to widen from the mid - 1970s onwards. This period reflec ts the influx of immigrants fleeing political uprising in Mindanao (southern Philippines) in the late 1970s, many of whom settled in coastal villages or on outer islands where they engaged in fishing. Sabahâs total catches are increasingly becoming more commercialized, with the contribution of traditional to total catches growing at a slower rate than commercial catches in the past two decades. Despite the large number of traditional participants, traditional catch only made up on average 35% of total cat ch since 1991. Nevertheless, small - scale fisheries are disproportionately important to those who rely on these resources for livelihood and food security (Whittingham et al ., 2003; Sadovy, 2005). Indeed, fishing remains the primary, and in many cases, the sole source of income and employment in Sabahâs fishing villagers (Wood, 2001; Teh et al ., 2005; 2007), which are also among the poorest communities in the country. On the other hand, a substantial portion of fish landed by the commercial sector is low v alue or inedible fish destined for fishmeal production or for processing into frozen seafood products for export. From 1992 to 1999, 142,166 t of fishmeal using approximately 531,000 t of raw materials (or on average, approximately 40% of annual marine lan dings) was produced in Sabah. Of this, slightly over 60% was
17 exported. In fact, several purse seine
exported. In fact, several purse seine vessels are operated specifically for capturing the raw materials for fishmeal production (Biusing, 2001). As such, the commercial fishery sector has minim al contribution to sustaining the nutritional needs of Sabahâs human population. The increasing trend in commercial landings actually masks the fact that prawns, the most valuable commercial resource, have been overexploited. Catch per unit of effort has been on a downward trajectory since the early 1970s, and prawns are considered to be exploited beyond the upper limits of sustainable production (Biusing, 2001). The high amount of low value fish in Sabahâs trawl catches is similar to 94 Fisheries catch reconstructions: Islands , Part I , Zeller and Harper neighboring Thailand and the Philippines, where the trawl fleets have led to degradation of coastal marine ecosystems (Christensen and Pauly, 2001). It is highly likely that this is also the case in Sabah. Importantly, the trawl sector has likely had a larger impact on the marine environment than that suggested by the decline in prawn catches recorded in the official statistics. Our catch reconstruction suggests that discards from the start of the prawn trawl fishery in the early 1960s to 1990 totaled about 973,000 tonnes, a n amount almost equal to the reported landings, and 5.6 times higher than the reported prawn catches for that period. Forage fish play an important ecological role in transferring energy from plankton to higher trophic level groups, such as larger fishes a nd marine mammals (Alder et al. 2008). The removal of forage fish species can therefore have negative consequences for species in the entire ecosystem. While some traditional gears take incidental catches of cetaceans (Jaaman et al. , in press) and possibly turtles, there was minimal discarded bycatch observed in small - scale artisanal catches, as fishers tend to keep damaged or low value fish for their own consumption (L . Teh, pers. obs.). The use of trawler bycatch to make fish balls, fish cakes, and othe r products developed in the late 1970s (Snell, 1978a), thereby reducing the economic and biological waste to a certain extent. Further, trawler bycatch has reportedly landed since the early 1990s for fishmeal (Biusing, 2001). Nevertheless, the creation of a fishmeal market creates little incentive for trawl operators to decrease the environmental impact of trawling. The efficiency of fishmeal production is such that there have been shortages of raw materials, necessitating the import of trash fish from Ind onesia (Biusing 2001). The demand for fishmeal is driven by global growth in aquaculture production, and increasing demand from developed countries for omega 3 rich supplements such as fish oils (Naylor et al ., 2009, Jenkins et al ., 2009). On the positive side, the Sabah Fisheries Department recognizes the need to decrease trawling effort within inshore coastal waters, and has plans to phase out small trawlers less than 40 GRT in size (Biusing, 2001). However, it remains to be seen whether this effort will be replaced with bigger trawlers diverted to fishing in deeper offshore areas. The reconstructed traditional catch trend shows that catches at the fishery level have been increasing steadily since the 1990s, even though we based the estimate on an assume d decreasing catch rate for the period. This is being driven by the large number of participants in traditional, small - scale fisheries, and may suggest that fisheries resources may not be able to support the current level of fishing pressure for much longe r. This is of concern given that fish is the cheapest animal protein in Sabah, and is still a staple food source, especially for the rural population. For instance, according to a national food and nutrition survey, marine fish is consumed daily, with the frequency of daily intake being significantly higher among rural adults (Norimah et al. , 2008). Sabahâs population has increased 6.5 fold since 1960, with an annual population growth rate bet
18 ween 1991 and 2000 of 4.5% (Saw, 2007)..")
ween 1991 and 2000 of 4.5% (Saw, 2007). Population pressure, co mbined with the prevailing poverty of fishing villages, suggests that Malthusian overfishing (Pauly et al. , 1989) is occurring in Sabahâs small - scale fisheries (Teh and Sumaila, 2007). Indeed, unsustainable fishing methods using dynamite and cyanide contin ue to be persistent problems in Sabah, resulting in extensive damage to coral reef habitat. The continued arrival of migrants from the Philippines and Indonesia will only add to the increasing pressure on fisheries resources, as they increase local fish de mand and enter an already crowded traditional fishery. Indeed, in interviews with small - scale artisanal fishers, Teh et al. (2007) found that an increase in the number of fishers was the most frequently mentioned reason when fishers were asked about the re ason for a decrease in catches. Over 80% of Sabahâs coral reefs are at risk from anthropogenic activities (Burke et al. , 2002), thus threatening Sabahâs vital reef - based fisheries as well. Overall, coral reef fish catches have been declining (Cabanban an d Biusing, 1999). Demand from global seafood markets is a primary driver for the overfishing of several reef resources in Sabah. Catches of fish species targeted for the lucrative live reef food fish trade, such as coral groupers ( Plectropomus spp. and Epi nephelus spp.) and humphead wrasse ( Cheilinus undulatus ), have drastically declined since the 1990s (Daw et al., 2002; Scales et al., 2007; Teh and Sumaila, 2007; Teh et al., 2007). Underwater surveys have also shown that the abundance of commercially impo rtant fish are very low, and are even locally extinct at some locations (Oakley et al. , 1999; Pilcher and Cabanban, 2000; Koh et al. , 2002). Landings of sea cucumbers, which are collected by small - scale fishers for the bêche - de - mer trade, have also decline d since the 1980s and 1990s (Choo, 2004). Importantly, current bêche - de - mer landings are made of less valuable species compared to before (Choo, 2004). Fisheries catch reconstructions: Islands , Part I, Zeller and Harper 95 Other indications that Sabahâs reef fisheries are overfished include a decrease in the mean size of fi sh caught, and the need for fishers to travel further offshore and more distant fishing grounds to catch fish (Teh et al. , 2007). At the same time, anecdotal evidence from small - scale fishers indicates that their catches are being adversely affected by pur se seine and trawl vessels which intrude into their traditional fishing zones (Biusing, 2001; Teh et al. , 2007), leading to harmful effects on the coral reef environment and jeopardizing near shore fish stocks that are targeted by the traditional sector. T he interaction between trawl and traditional fisheries already led to conflicts in Peninsular Malaysia (Wong, 1982; Chee, 1995), and steps should be taken to ensure the same does not happen in Sabah. Government policies aimed at traditional fishers are f ocused on poverty alleviation and ensuring livelihoods and employment. To date, this has involved programs aimed at providing alternative livelihoods such as seaweed farming or agricultural projects. Simultaneously however, there has been widespread provis ion of subsidies for fishing gear, boats, fuel, as well as monetary incentives (e.g., RM 0.10 kg - 1 of fish landed, beginning in the latter half of 2008). These strategies can have adverse effects on fisheries sustainability (Munro and Sumaila, 2002), and s hould be urgently reconsidered in light of our findings. Better avenues for use of such funds would be in the realm of local, community - based co - management arrangements in relation to the establishment and enforcement of no - take marine reserves that can co ntribute to more stable yields to traditional fishers as well as ecosystem preservation and hence sustainable production potential (e.g., Russ et al ., 2004) Our results do not include catches by several foreign companies that fished in Sabah for short per iods of time during
19 the 1950s and 1960s. For instance, a Ja
the 1950s and 1960s. For instance, a Japanese company catching offshore tuna operated for 2 years in the 1950s. Similarly, in 1951 the British government allowed a Hong Kong company with a fleet of 3 trawlers to fish, while in 1958 a Fi lipino company started to catch fish around northern Sabah (Anon . , 1958). We do not explicitly account for non - prawn invertebrate catches; instead, these catches, often derived by reef - and shore - gleaning, are encompassed within the overall catch rates us ed. Subsequently, the invertebrate catches presented here are coarse estimates, and are likely underestimates relative to finfish. As reef gleaning is a common activity (Sather, 1997; Wood, 2001; Teh et al. , 2005), this is an area that requires further res earch. CONCLUSION This study shows that the traditional sector is considerably larger than officially recorded in terms of participants, and thus its importance to society is likely to have been underestimated. Importantly, this historical perspective of Sabahâs fisheries indicates that even as Sabahâs population and the number of fishers grew rapidly, small - scale fishery resources were able to support the growing local fish demand. However, this is now at risk, and maintaining sustainable small - scale i nshore fisheries is of utmost importance if these resources are to continue supporting local subsistence and artisanal fishing economies. In contrast, while commercial fisheries catches are comparatively larger, their contribution to Sabahâs food securit y is minimal, as a substantial proportion of commercial landings are processed into fishmeal, while higher quality fish are frozen and exported. Further, our study indicates that discards from the commercial prawn fishery totaled almost a million tonnes pr ior to the 1990s, thus likely had a more serious impact on the marine environment than perceived from the official statistics. Overall, our study points to the need for increased attention on understanding and managing the level of fishing pressure on Sa bahâs marine resources, especially for sm all - scale fisheries resources. Government aid to traditional fishers has historically been aimed at poverty alleviation. Unfortunately, many of these programs, in the form of subsidies and grants, may have created p erverse incentives to intensify the exploitation fisheries resources. Instead, policies aimed at addressing the unrecorded effort we have estimated here are needed in order to ensure the sustainability of inshore fisheries resources. 96 Fisheries catch reconstructions: Islands , Part I , Zeller and Harper ACKNOWLEDGEMENTS We thank E. Jinuat of the Sabah Fisheries Department for his input. We acknowledge the support of the Sea Around Us Project, a scientific collaboration between the University of British Columbia and the Pew Environment Group. REFERENCES Abdul Mannan, Q . (1982) Sabah fishermen and their economy. Ko - Nelayan, Kota Kinabalu. Alder, J., Campbell, B., Karpouzi, V., Kaschner, K., and Pauly, D. (2008) Forage fish: from ecosystems to markets. Annual Rev iews in Environment and Resources 33: 153 - 166. Almada - Villel a, P. C. (1997) Pilot fisheries socio - economic survey of two coastal areas in eastern Sabah. Pages 33 - 44 in S. L. Fowler, T. M. Reed, and F. A. Dipper, editors. Elasmobranch biodiversity, conservation and management: proceedings of the international semina r and workshop, Sabah, Malaysia, July 1997. IUCN. Anon . (1957) Colony of North Borneo Annual Report 1957. Her Majesty's Stationery Office, London. Anon. (1947) Colony of North BorneoAnnual Report 1947. His Majesty's Stationery Office, London. Anon (1953) C olony of North Borneo Annual Report 1953. Her Majesty's Stationery Office, London. Anon. ( 1955) Colony of North Borneo Annual Report 1955. Her Majesty's Stationery Office, London. Anon (1956) Colony of North Borneo Annual Report 1956. Her Majesty's Station ery Office, London. Anon . (1958) Colony of North Borneo Annual Report 1958. Her Majesty's Statione
20 ry Office, London. Anon . (1990a) Mor Mor")
ry Office, London. Anon . (1990a) More illegal aliens than Sabahans by 2008. In: The Straits Times, Kota Kinabalu. Anon . (1990b) Sabah feels strain of hosting 500,000 illegal immigrants. In The Straits Times. Anon . (1991) Annual Fisheries Statistics 1991. Malaysia Department of Fisheries, Putrajaya. Anon . (1998) The Coastal Zone Profile of Sabah. In: Sabah Ministry of Town Planning, Kota Kinabalu. Anon . (2001) P opulation and Housing Census of Malaysia 2000 Population Distribution by Local Authority Areas and Mukims. Malaysia Department of Statistics, Putrajaya, Malaysia. Anon . (2006) Annual Fisheries Statistics 2006. Malaysia Department of Fisheries, Putrajaya. A non . (2008a) Squatter village a likely target. In: The Straits Times, Kota Kinabalu. Anon . (2008b) RM500,000 incentive for fishermen, breeders and aquaculturists in Sabah. In: Bernama Daily Malaysian News. Anon . (2008c) Project to improve livelihood of ha rdcore poor. In: New Straits Times, Kuala Lipis. Anon . (2008d) Population, Household and Living Quarters Malaysia 2008. Department of Statistics, Malaysia. Available at: www.statistics.gov.my. [Accessed October 2009]. Anon . (2009) Ko - Nelayan retained as sole subsidised diesel supplier. In: Bernama Daily Malaysian news. Biusing, R. E. (2001) Assessment of coastal fisheries in the Malaysian Sabah portion of the Sulu - Sulawesi Marine Ecoregion (SSME). WWF Malaysia, Sabah. Burke, L., Selig, L. and Spalding, M. (2002) Reefs at Risk in Southeast Asia. World Resources Institute, Washington. Cabanban, A. S., and Biusing, R.E. (1999) Coral reef fisheries and their contribution to marine fish production in Sabah, Mal aysia. In: A. S. Cabanban and Philips, M. ( eds.) Proceedings of the workshop on aquaculture of coral reef fishes and sustainable reef fisheries. Institute of Development Studies, Kota Kinabalu. Chee, P. E. (1995) Tuna fisheries interactions in Malaysia. In: R. S. Shomura, Majkowski, J. and Harman, R. F., (eds.) Status of Interactions of Pacific Tuna Fisheries in 1995. Proceedings of the Second FAO Expert Consultation on Interactions of Pacific Tuna Fisheries. FAO, Shimizu, Japan. Choo, P. S. (2004) Fisheries, trade and utilization of sea cucumbers in Mala ysia. p. 57 - 68 In: C. Conand, Purcell, S. Uthicke, S., Hamel, J. F. and Mercier, (eds.) Advances in sea cucumber aquaculture and management. FAO, Rome. Christensen, V., and Pauly, D. (2001) Coral reef and other tropical fisheries. p. 534 - 538. In: J. H. Steele, Thorpe, S. A. and Turekian, K. K., (eds.) Encyclopedia of Ocean Sciences. Academic Press, San Diego. Daw, T., Jeffrey, L. and Bin Ali, M. A. (2002) Preliminary Assessment of the live reef fish trade in the Kudat region. WWF Ma laysia, Kota Kinabalu. Evans, I. H. N. (1915) North Borneo Markets. Man 15:23 - 25. Fisher, H. (2000) A socio - economic assessment of coastal communities of Pulau Banggi Sabah, East Malaysia. Master of Science. University of Minnesota. Foo, L. H., Khor, G. L., Tee, E. S. and Prab akaran, D. (2006) Dietary intake of adolescents in a rural fishing community in Tuaran district, Sabah. Malaysian Journal of Nutrition 12:11 - 21. Gopinath, N. and Puvanesuri, S. S. (2006) Marine capture fisheries. Aquatic Ecosystem Health & Management 9:215 - 226. Hassan, A. J. (1978) Characteristics of backdoor migrants to Sabah, Malaysia from the Philippines: the case of two island communities of Tawi - Tawi. Institute of Southeast Asian Studies, Singapore. Hotta, M. and Low, T. W. (1985) Fishermen Relocation Programme in Peninsular Malaysia. FAO, Rome. Institut Penyelidikan Marin Borneo (IPMB). (2003) Laporan Kajian Mengenai Pengetahuan dan Pandangan Masyarakt Pulau Banggi Terhadap Penubuhan Taman Tun Mustapha (Report on the knowledge and expectations of Pulau Banggi residents about Fisheries catch reconstructions: Islands , Part I, Zeller and Harper 97 the establishment of the Tun Mustapha Park). Institut Penyelidikan Marin Borneo, Universiti Malaysia Sabah, Kota Kinabalu. Jaaman, S. A., Lah - Anyi, Y. U.
21 and Pierce, G. J. (in press) The magnitu The magnitu")
and Pierce, G. J. (in press) The magnitude and sustainability of marine mamma l bycatch in fisheries in East Malaysia. Journal of the Marine Biological Association of the United Kingdom. Jacquet, J. and Zeller. D. (2007). Putting the âUnitedâ in the United Republic of Tanzania: Reconstructing marine fisheries c atches. In: D. Zeller and Pauly, D. (eds.) Reconstruction of marine fisheries catches for key countries and regions (1950 - 2005). Fisheries Centre Research Reports 15(2). Fisheries Centre, University of British Columbia, Vancouver. Jenkins, D.J.A., Sievenpiper, J.L., Pauly, D., Sumaila, U.R., Kendall, C.W.C. and Mowat, M. (2009) Are dietary recommendations for the use of fish oils sustainable? Canadian Medical Association Journal 180(6): 633 - 637. Jones, L. W. (1966) The population of Borneo A study of the peoples of Sarawak, Sab ah and Brunei. University of London the Athlone Press, London. Koh, L. L., Chou, L. M. and Tun. K. P. P. (2002) The status of coral reefs of Pulau Banggi and its vicinity, Sabah, based on surveys in June 2002. Department of Biological Sciences, National Un iversity of Singapore, Singapore. Lee, Y. L. (1968). Population changes in Sabah, 1951 - 60. The Journal of Tropical Geography 26:55 - 68. Leete, R. (2008). Sabah's human development progress and challenges. United Nations Development Programme, Kuala Lumpur. Leete, R., and Kwok, K.K. (1986) Demographic changes in east Malaysia and their relationship with those in the Peninsula 1960 - 80. Population Studies 40(1):83 - 100. Loper, C., Pomeroy, R. Hoon, V. McConney, P. Pena, M. Sanders, A. Sriskanthan, G. Vergara, S . Pido, M. Vave, R. Vieux, C. and Wanyonyi, I. (2008) Conditions along the world's tropical coasts: 2008. National Oceanic and Atmospheric Administration, Global Coral Reef Monitoring Network, Conservation International. Manan, M. A. (2003) Problems and pr ospects of industrial relations: the social and economic dimensions of foreign workers in fishing enterprises in Sabah, East Malaysia. Pages 241 - 255 in Economic Prospects, Cultural Encounters and Political Decisions: Scenes in a Moving Asia (East and South east) The Work of the 2002/2003 API Fellows. Sasyaz Holdings Sdn. Bhd., Kuala Lumpur. McManus, J. W. (1997) Tropical marine fisheries and the future of coral reefs: a brief review with emphasis on Southeast Asia . Coral Reefs 16:S121 - S127. Mohammad Ariff, M . R. (1999) Dari pemungutan tripang ke penundaan udang: Sejarah perkembangan perusahaan perikanan di Borneo Utara, 1750 - 1990 (From sea cucumbers to prawn trawling: History of fisheries development in North Borneo, 1750 - 1990). Penerbit Universiti Malaya. Mu nro, G., and Sumaila, U.R. (2002) The impact of subsidies upon fisheries management and sustainability: the case of the North Atlantic. Fish and Fisheries 3 (4): 233 - 250. Naylor, R.L., Hardy, R.W., Bureau, D.P., Chiu, A., Elliott, M., Farr, A.P., Forster, I., Gatlin, D.M., Goldburg, R.J., Hua, K., and Nichols, P.D. Feeding aquaculture in an era of finite resources. Proceedings of the National Academy of Sciences 106 (36): 15103 - 15110. Norimah, A. K., Safiah, M., Jamal, K., Haslinda, S., Zuhaida, H., Rohida , S., Fatimah, S., Norazlin, S. K., Poh, B., Kandiah, M., Zalilah, M. S., Wan Manan, W. M., Fatimah, S. and Azmi, M. Y. (2008) Food Consumption Patterns: Findings from the Malaysian Adult Nutrition Survey (MANS). Malaysian Journal of Nutrition 14:25 - 39. Oa kley, S., Pilcher, N., Atack, K., Digges, C., Enderby, S., Mackey, G., Clubb, R., Stapelton, K., Toh, S. M., Huet, C. and Mor ton, T. (1999) Reefs under attack: the status of coral reefs of Sabah, East Malaysia. in 4th international conference on the marine biology of the South China Sea 20 - 22 October 1999, Quezon City. Pauly, D., Silvestre, G. and Smith, I. R. (1989) On development, fisheries, and dynamite: a brief review of tropical fisheri es management. Natural Resource Modelling 3:307 - 329. Pilcher, N., and Cabanban, A. S. (2000) The status of coral reefs in eastern Malaysia. Australian Institute of Marine Science
22 , Townsville. Piper, M. (1984) Settle Settle")
, Townsville. Piper, M. (1984) Settlements on eight Semporna Islands. Sabah Society Journal 7:303 - 329. Russ, G., Alcala, A. Maypa, A. Calumpong, H. and White, A. (2004) Marine reserve benefits local fisheries. Ecological Applications 14: 597 - 606 Sadovy, Y. (2005). Trouble on the reef: the imperative for managing vulnerable and valuable fisheries. Fish and Fisheries 6: 167 - 185 Sam, I. (2008). Illeg al and unwelcome, migrants overwhelm Malaysia's Borneo. in Agence France Presse. Sather, C. (1984). Sea and shore people: ethnicity and ethnic interaction in southeastern Sabah. Contributions to Southeast A sian Ethnography 3:3 - 27. Sather, C. (1985). boat c rews and fishing fleets; the social organisation of maritime labour among the Bajau Laut of southeastern Sabah. Contributions to Southeast Asian Ethnography 4:165 - 214. Sather, C. (1997). The Bajau Laut Adaptation, history, and fate in a maritime fishing so ciety of south - eastern Sabah. Oxford University Press, Kuala Lumpur. Saw, S. H. (2007). The population of Malaysia. Institute of Southeast Asian Studies, Singapore. Scales, H., A. Balmford, and A. Manica. (2007). Impacts fo the live reef fish trade on popu lations of coral reef fish off northern Borneo. Proceedings of the Royal Society B 274:989 - 994. Snell, P. J. I. (1978a). The production of fish balls and fish cakes in Sabah and the possible use of trawler bycatch for suc h products. Pages 581 - 600 in Sympos ium on fish utilization technology and marketing in the IPFC Region 8 - 17 March 1978. FAO, Manila, Philippines. 98 Fisheries catch reconstructions: Islands , Part I , Zeller and Harper Snell, P. J. L. (1978b). A preliminary survey of the prawn trawling industry in Sabah and its non - commercial fish catch. Pages 86 - 100 in Symposiu m on fish utilization technology and marketing in the IPFC Region 8 - 17 March 1978. FAO, Manila, Philippines. Teh, L., and U. R. Sumaila. (2007). Malthusian overfishing in Pulau Banggi? Marine Policy 31:451 - 457. Teh, L., U. R. Sumaila, and A. S. Cabanban. ( 2005). The reef fisheries of Pulau Banggi, Sabah: A preliminary profile and assessment of ecological and socio - economic sustainability. Fisheries Research 76:359 - 367. Teh, L.C.L., L.S.L. Teh, and F. C. Chung. (2008). A private management approach. Biodiver sity and Conservation 17:3061 - 3077. Teh, L. S. L., D. Zeller, A. Canbanban, L. C. L. Teh, and U. R. Sumaila. (2007). Seasonality and historic trends in the reef fisheries of Pulau Banggi, Sabah, Malaysia. Coral Reefs 26:251 - 263. Tregonning, K. G. (1965). H istory of modern Sabah (North Borneo, 1881 - 1963), 2nd edition edition. University of Malaya Press, Singapore. Viswanathan, K. K., Y. Jeon, I. Haji Omar, J. Kirkley, D. Squires, and I. Susilowati. (2000). Technical efficiency and fishin g skill in developing country fisheries: the Kedah, Malaysia trawl fishery. in Y. Matsuda, T. Yamamoto, and A. L. Shriver, editors. Twelfth Biennial Conference of the International Institute of Fisheries Economics and Trade. International Institute of Fisheries Economics and T rade, Tokyo, Japan. Warren, J. F. (1971). The North Borneo Chartered Company's Administration of the Bajau, 1878 - 1909 The Pacification of a Maritime, Nomadic People. Center for International Studies Ohio University, Ohio. Whittingham, E., J. Campbell and P . Townsley (2003). Poverty and Reefs. Paris, DFID â IMM â IOC/UNESCO : 260. Wong, L. M. (1982). Country Situation Paper - Malaysia (Sabah) The status of rural coastal fisheries in Sabah. FAO, Manila. Wood, E. (2001). Use of natural resources in the proposed Sem porna Islands park. Marine Conservation Society, Sabah Parks, WWF Malaysia, Nature Link. Zeller, D., S. Booth, P. Craig, and D. Pauly. (2006). Reconstruction of coral reef fisheries catches in American Samoa, 1950 - 2002. Coral Reefs 25:144 - 152. Zeller, D., S. Booth, G. Davis, and D. Pauly. (2007). Re - estimation of small - scale fisheries catches for U.S. flag island areas in the Western Pacific: The last 50 years. Fishery Bulletin 1