
Paul D Mitchell Agricultural amp Applied Economics Learning Goals How to create and read a balance sheet for farm operations The difference between a Market Basis and a Cost Basis balance sheet for asset valuation and when to use each one ID: 1029854
Download Presentation The PPT/PDF document "The Farm Balance Sheet AAE 320" is the property of its rightful owner. Permission is granted to download and print the materials on this web site for personal, non-commercial use only, and to display it on your personal computer provided you do not modify the materials and that you retain all copyright notices contained in the materials. By downloading content from our website, you accept the terms of this agreement.

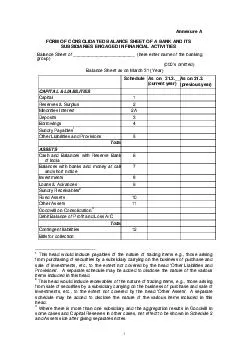

1. The Farm Balance SheetAAE 320 Paul D. MitchellAgricultural & Applied Economics
2. Learning GoalsHow to create and read a balance sheet for farm operationsThe difference between a Market Basis and a Cost Basis balance sheet for asset valuation and when to use each oneMethods used to depreciate assetsStraight line and declining balanceHow to depreciate farm assets for tax purposesHow to use depreciation tablesSection 179 depreciationDepreciation recapture (Form 4797)
3. What is a Balance Sheet?Systematic listing of everything owned and owed by a business/individualGives statement of owner equity at a point in timeTypically for end of accounting period, such as end of year for taxesInterim balance sheets often used/needed for loan applications
4. Balance SheetBalance sheet: Everything must balanceAsset: anything ownedLiability: debt or financial obligation owedThe Basic Accounting Identity must hold Assets = Liabilities + Owner Equity Adjust Owner Equity to make it balanceEquity is what’s left, the residual
5. Uses of a Balance SheetMeasures financial position of firm, focusing on long and short run measuresSolvency: measures relative relationships among assets, liabilities and equity to assess “health” of firm (financial ratios)Liquidity: measures ability to meet current financial obligations as they come due without disrupting normal business—ability to generate cash on short-term
6. Balance Sheet FormatAssetsLiabilitiesCurrent Assets$100Current Liabilities$50Non-Current Assets$150Non-Current Liabilities$100Owner Equity$100Total Assets$250Total Liability and Equity$250
7. AssetsAnything the firm owns that has value because can sell it and/or use it to produce sellable goodsLiquid assets: easy to sell, ready market for them (grain, feeder livestock)Illiquid assets: hard to sell quickly at full value (machinery, land, breeding livestock)
8. Two Types of Assets on a Balance SheetCurrent AssetsCash, bank accounts, marketable funds, accounts receivable (money owed to you), inventories of liquid assets: grain, feed, supplies, feeder livestockNon-Current AssetsEverything else: machinery, equipment, breeding livestock, buildings, land
9. Two Types of Liabilities on a Balance SheetObligations/debts owed, any outside claims against your assetsCurrent LiabilitiesFinancial obligations due within 1 yearAccounts at suppliers, farm store, etc.Interest & principle on operating and long-term loansAccrued expenses: property and income taxesNon-Current LiabilitiesEverything else not due in the next yearRemaining balance on long-term debts after deducting the current year’s payments
10. Oklahoma State University Example Farm Balance Sheethttp://factsheets.okstate.edu/documents/agec-752-developing-a-balance-sheet/
11. Alternative Balance Sheet Formats Use in AgricultureTraditional farm balance sheets have used other categories, but their use is decreasingSplit non-current assets into intermediate and fixed or long-term assetsIntermediate Asset: less liquid with life 1 to 10 years (machinery, equipment, perennial crops, breeding livestock)Fixed Asset: > 10 year life: land, buildingsIntermediate Liability: 1 – 10 year loansLong-term Liability: > 10 year loans
12. University of Minnesota FinPack examplehttps://extension.umn.edu/farm-finance/balance-sheet
13. Owner Equity = Net WorthValue left after assets are used to cover all liabilities, what you “own” in the farmYour current investment in the farmEquity changes for many reasonsProfits/losses from production activitiesSell assets for different values than on sheetAdd/withdraw capital from the farmAsset value changes if use market prices for asset valuation, e.g., land value increases
14. Owner Equity ChangesBusiness transactions only change the mix of assets/liabilities, not owner equityBuying a $10,000 piece of machinery does not change your equityIf cash purchase, current assets drop $10,000 and non-current assets increase $10,000If borrow $10,000, liability increases $10,000 and non-current assets increase $10,000Equity only changes due to business profit/loss, if you put money in/pull it out, and/or (in some cases) if asset values change
15. Think Break #9Fill in the empty entries in the balance sheetHow would the balance sheet change if you bought $100,000 of land by taking $40,000 from your savings and borrowing $60,000 from a bankAssetsLiabilitiesCurrent Assets$400,000Current Liabilities$150,000Non-Current Assets?Non-Current Liabilities$350,000Owner Equity?Total Assets$1,000,000Total Liability & Equity$1,000,000
16. Asset Valuation ProblemHow do you value assets when developing a balance sheet? Typically use two methods: Cost or Market BasisBasic accounting says use Cost basis, but not always right in agricultureCost Basis: Asset Value = purchase cost minus depreciation, or = farm production costMarket Basis: Asset Value = current market value minus any selling costs
17. Market BasisAssets valued at current market value minus selling costsAsset value (and so your equity) responds to inflation and price changes, so often gives higher values (and so higher equity)Asset price changes can hide management problems because equity increasingMain Advantage: more accurate measure of current financial status and collateral available for loans, so used by lenders
18. Cost BasisAsset value = purchase cost minus depreciation, or cost to produce the assetMore conservative, following accepted accounting practices in other businessesEquity changes only from retained earnings (profits), not from asset price changes, so used to evaluate ability as a farm managerCan misrepresent true value of business
19. Farm Financial Standard CommitteeRecommends using both methods1) Market basis balance sheet with cost basis asset values in attached schedules or in footnotes2) Double Column balance sheet for assets, with market basis and cost basisMeasure true value market of your business and identify possible management problems
20. Iowa State University examplehttps://www.extension.iastate.edu/agdm/wholefarm/html/c3-20.html
21. Both Methods use Both MethodsFarm AssetValue used for Cost Basis Value used for Market BasisRaised grain and feeder livestockMarketMarketPurchased grain and feeder livestockMinimum of Cost and MarketMarketAccounts ReceivableCostCostPrepaid ExpensesCostCostInvestment in crops growing in the fieldCostCostPurchased breeding livestockCostMarketRaised breeding livestockCost or a Base ValueMarketMachinery, equipment, buildings, landCostMarket
22. Grain/Livestock Inventories and Crops in the FieldsGrain in the bin and animals on the lot ready to sell use Market Basis: very liquid assetsException: Purchased grain/livestock that has gone up in value, then use cost if a cost basis balance sheetCrops still growing in the field use a Cost Basis since they are still subject to production risks“Don’t count your chickens before the eggs hatch”
23. Raised Breeding LivestockCost Basis You are supposed to accumulate all costs to get each animal from birth to productive age (and not include these in the income statement), and then depreciate this total cost over its useful lifetime just as though purchased it at this priceUnrealistic and overly detailed for farmsAlternative Develop a fixed base value for each age/type of animal to approximate this cost and its depreciationBase value won’t change with asset market pricesThink of it as your average cost of production to raise the “asset”
24. DepreciationAnnual loss in value of a working asset due to use, wear, aging, and technical obsolescenceWhat assets due you depreciate?Useful life > 1 yearUseful life can be determined (not unlimited)Machinery, equipment, buildings, fences, breeding livestock, perennial crops, irrigation wells, land improvements (wells, drainage)Land not depreciated, as has unlimited life
25. Depreciation: Why it MattersFarmers track depreciation in asset value for three main reasons1) Taxes: deduct depreciation as a cost of business, subtract from annual income2) Asset “true” value or farm book value: tax depreciation not equal true losses, so track assets for accurate market basis balance sheet3) Insurance: do you want to insure value or replacement cost? Also, some companies depreciate assets for insurance values
26. Depreciation Definitions and IntuitionCost: All costs paid for the asset, including price, taxes, delivery and installation fees, expenses to get the asset into useUseful Life: Number of years you expect to use the asset in your businessSalvage Value: Expected market value at end of useful you assigned; zero if you will use it until worn out and has no scrap or junk value at endIntuition: Want to allocate the initial cost of a long-term asset across the useful life you give itCost minus Salvage Value is asset’s total depreciation over its Useful Life: How much depreciation do you assign to each year?Several formulas make assumptions and estimate annual depreciation, none is correct for all assets in all situations
27. Graphics of DepreciationTimeValue ($)Initial CostSalvage ValueUseful LifeTotal Depreciation to Allocate
28. Graphics of DepreciationTime (Years)Value ($)BAUse a mathematical formula to describe how to get from Point A to Point BSlope of the line between any two years is the annual depreciation during that year Depreciation = DValue/DtOne YearDt = 1DV
29. Straight Line DepreciationDraw a straight line between beginning and ending values, which gives a constant depreciation each yearAnnual Depreciation = (Cost – Salvage Value)/Useful LifeAlternative: Express as a depreciation rateAnnual Depreciation = (Cost – Salvage Value) x RSL RSL = 1/Useful Life = Depreciation Rate Example: RSL = 1/10 = 0.10 = 10% 10% annual depreciation rate , means that the asset loses 10% of the total depreciation each year
30. Straight Line Depreciation Example 1$100,000 machine, use for 6 years and expected salvage value of $40,000Annual Depreciation = ($100,000 – $40,000)/6 = $10,000RSL = 1/6 = 0.167 = 16.7%Annual Depreciation = ($100,000 – $40,000) x 16.7% = $10,020
31. Straight Line Depreciation Example 1YearValue AtYear StartBeginning BasisDepreciationValue AtYear EndEnding Basis1100,00010,00090,000290,00010,00080,000380,00010,00070,000470,00010,00060,000560,00010,00050,000650,00010,00040,000
32.
33. Straight Line Depreciation Example 2$100,000 machine, use for 5 years and completely depreciate ($0 salvage value)Annual Depreciation = ($100,000 – $0)/5 = $20,000RSL = 1/5 = 0.20 = 20%Annual Depreciation = $100,000 x 20% = $20,000 or simply purchase price x 20%
34. Straight Line Depreciation Example 2YearValue AtYear StartBeginning BasisDepreciationValue AtYear EndEnding Basis1100,00020,00080,000280,00020,00060,000360,00020,00040,000440,00020,00020,000520,00020,0000
35. Think Break #10You buy a piece of equipment for $70,000 with a useful life of 3 years and expected salvage value of $10,000What is the Straight Line depreciation for the second year?
36. Declining BalanceDepreciation = constant percentage of the asset’s current basisNot (cost – salvage value)Depreciation = Current Basis x RDBRDB = Declining Balance Depreciation RateDeclining Balance: $ value of depreciation decreases each year, though constant annual % depreciation rate
37. Declining BalanceDeclining Balance Depreciation Rate RDB usually a multiple of the Straight-Line Depreciation Rate RSL = 1/Useful LifeRDB = 2 x RSL, is Double Declining Balance or 200% Declining BalanceAlso see 1.75/175%, 1.50/150% and 1.25/125% declining balanceDepreciation for taxes uses declining balance
38. Double Declining Balance Example$100,000 machine, use for 6 years and expected salvage value of $40,000Double Declining Balance depreciation rateRSL = 1/6 = 16.67%RDB = 2 x RSL = 2/6 = 2 x 16.67% = 33.3%During the year, the asset loses 33% of its initial value in the year1st Year DDB Depreciation is $100,000 x 1/3 = $33,333
39. Double Declining Balance ExampleYearCurrent(Beginning)BasisCalculationDepreciationEndingBasis1100,000100,000 x 33%33,33366,667266,66766,667 x 33%22,22244,444344,44444,444 x 33%14,81529,630429,63029,630 x 33%9,87719,753519,75319,753 x 33%6,58413,169613,16913,169 x 33%4,3908,779
40. Double Declining Balance ExampleYearCurrent (Beginning) BasisDepreciationEnding Basis1100,00033,33366,667266,66722,22244,444344,44414,81529,630429,6309,87719,753519,7536,58413,169613,1694,3908,779Problem: Basis can fall below salvage value
41. Potential Problems with Double Declining BalanceAssets with positive salvage value, basis can fall below salvage valueFix: Stop depreciation at salvage valueAssets with zero salvage value, basis never reaches zeroFix 1: Switch to straight line after a set timeFix 2: Take remaining value in last year
42. Double Declining Balance Example(Salvage value = $40,000)YearBeginning BasisDepreciationEnding Basis1100,00033,33366,667266,66722,22244,444344,4444,44440,000440,000040,000540,000040,000640,000040,000
43.
44. Compare the Two Depreciation MethodsStraight Line DepreciationSlowest depreciation and easy to useFinishes at the salvage value without any adjustmentsDeclining BalanceFaster depreciation than straight line, which better matches some assets’ actual depreciationRequires adjustment to finish at the salvage value
45. Depreciation Graphics
46. Asset Value Graphics
47. Think Break #11Machine costs $7000 with a useful life of 3 years and salvage value of $10001) What is the double declining balance depreciation during the 1st year?2) What is machine’s basis at the end of the 1st year?3) What is the double declining balance depreciation during the 2nd year?4) What is machine’s basis at the end of 2nd year?
48. Depreciation and TaxesUS tax code has rules and options for depreciating business assets, including those used by farmersMACRS: Modified Accelerated Cost Recovery SystemThree methods used: 200% DB, 150% DB, and Straight LineDepends on asset typeSometimes you get to chooseDB: Switches to SL to fully depreciate asset
49. Depreciation and TaxesDetermine asset’s basis (called tax basis)Basis adjusted for several reasons, such as improvements made, damage, etc. Calculate depreciation as a % of initial tax basis, which usually equals initial purchase price% taken from a tableTax tables assume zero salvage value Deduct depreciation from your taxable income (so you pay lower taxes!)Tax basis ≠ true value or your book value
50. Tax Depreciation ExampleIRS Publication 946: “How to Depreciate Property”Rules apply as to how many years you can depreciate certain types of propertyBreeding livestock, machinery/equipment: 5 yearsGrain bins, fences, land improvements: 7 yearsBuildings and tree/vine: 10 yearsLand improvements: 15 years
51. Tax Depreciation ExampleHalf-year or mid-quarter conventionDepending on when purchased during year, can only take part of annual depreciation in first year and again in last yearExample of Half-Year ConventionSay you have a 5 year asset, you can take half of year’s depreciation in year 1, full year depreciation in years 2, 3, 4 and 5 and another half year depreciation in year 6
52. Three-Year Example for a $10,000 Asset, Using Tax Table A-1 YearDepreciation Rate from Tax TableDepreciationRemaining Tax Basis133.33%$3,333$6,667244.45%$4,445$2,222314.81%$1,481 $7414 7.41% $741 $0Depreciation each year is the Purchase Price times the Rate from the tax table. Notice rates add to 100%, which implies take full value over “tax life” of the asset.
53. Depreciation and TaxesSection 179: Allows taking a large amount of depreciation in year purchase assetWay to really reduce income (and so taxes)Buy equipment/building and write full cost off as a cost of business in that yearThe ending basis of asset can be zero in first yearMany farmers do this in years they make more money than usual in order to reduce taxes paid
54. Depreciation and TaxesDepreciation Recapture: Form 4797Depreciation Recapture: When sell an asset, if the sales price differs from the tax basis, file Form 4797If sale price > remaining tax basis: claim extra as ordinary income and pay income taxesIf sale price < remaining tax basis: claim extra depreciation and reduce ordinary income and income taxesEventually the government gets its taxes if you “over depreciate” an asset via tax laws (e.g., Section 179)
55. Depreciation and TaxesMain Point: Tax depreciation not the same as “real” depreciationSection 179 depreciation really throws it offBusinesses & farms: some keep separate recordsTax depreciation and tax basis recordsCan differ between federal and stateBook value for farm balance sheet for farm’s “real” value for loan applicationsRecords of asset values for insurance purposesCan create complicated farm records
56. SummaryExplained concept of a balance sheetCurrent and Non-current AssetsCurrent and Non-current LiabilitiesEquity: what balances the sheetHow and why to value assets using a Cost or Market BasisHow to depreciate assetsStraight Line or Declining Balance methodsHow to depreciate farm assets for taxesDepreciation tables, section 179, form 4797 depreciation recaptureNext Section: What do you do with a balance sheet?