
Meltzer MI Estimating SARS Incubation Period Emerg Infect Dis 20041081504 httpsdoiorg103201eid1008040427 ID: 1011493
Download Presentation The PPT/PDF document "Figure 1 Figure 1. Simulation o..." is the property of its rightful owner. Permission is granted to download and print the materials on this web site for personal, non-commercial use only, and to display it on your personal computer provided you do not modify the materials and that you retain all copyright notices contained in the materials. By downloading content from our website, you accept the terms of this agreement.


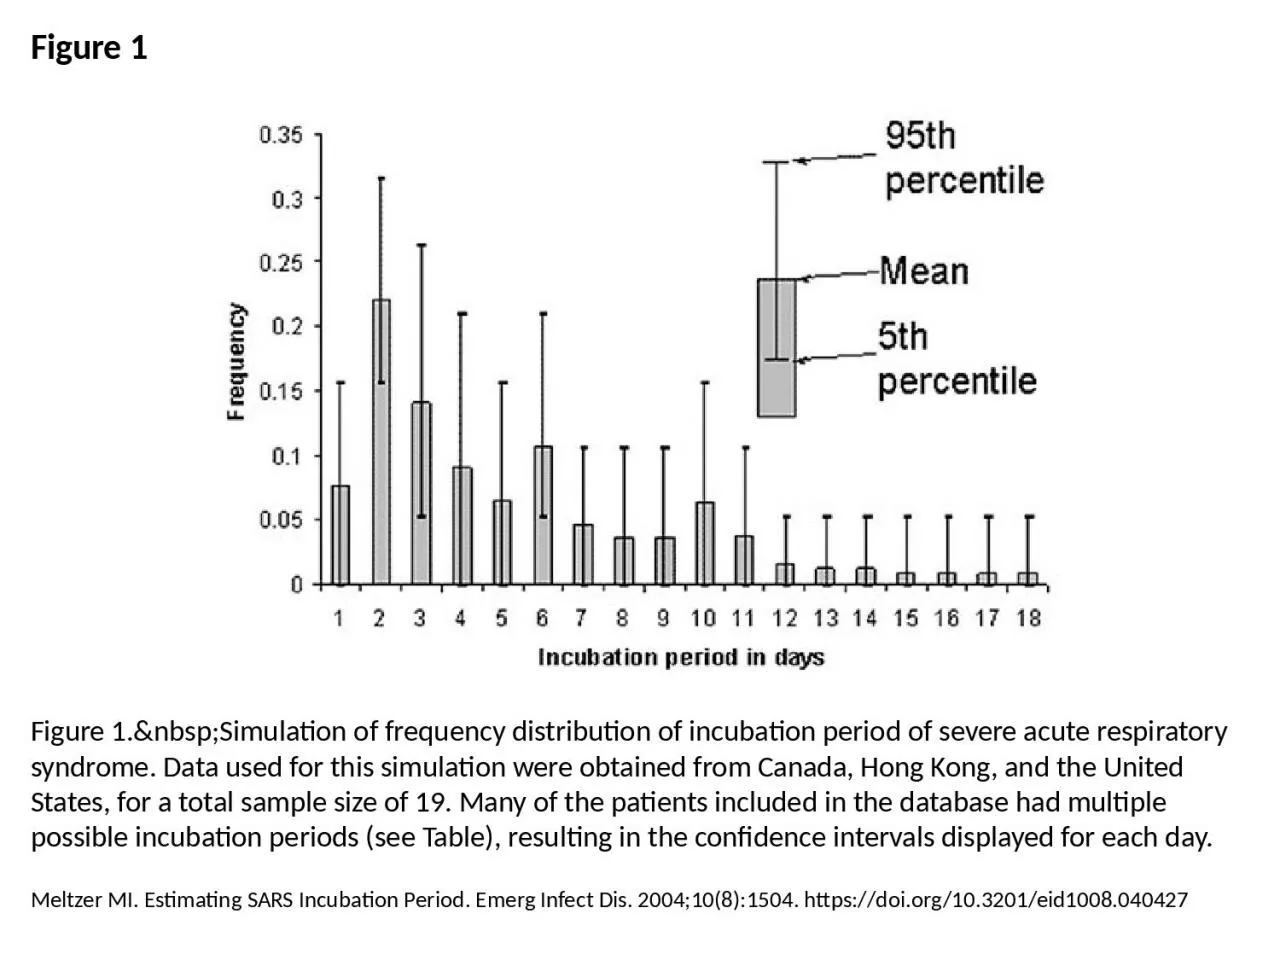
1. Figure 1Figure 1. Simulation of frequency distribution of incubation period of severe acute respiratory syndrome. Data used for this simulation were obtained from Canada, Hong Kong, and the United States, for a total sample size of 19. Many of the patients included in the database had multiple possible incubation periods (see Table), resulting in the confidence intervals displayed for each day.Meltzer MI. Estimating SARS Incubation Period. Emerg Infect Dis. 2004;10(8):1504. https://doi.org/10.3201/eid1008.040427