
Dr Gene Fry March 2019 Climate Changes without Humans Climate has been changing for hundreds of millions of years MY Mostly it s been much warmer with much higher CO ID: 758091
Download Presentation The PPT/PDF document "Global Warming So What?" is the property of its rightful owner. Permission is granted to download and print the materials on this web site for personal, non-commercial use only, and to display it on your personal computer provided you do not modify the materials and that you retain all copyright notices contained in the materials. By downloading content from our website, you accept the terms of this agreement.


Slide1
Global Warming
So What?
.
Dr. Gene Fry
.
October 2020
.
Slide2
Climate Changes without Humans .
Climate has been changing for hundreds of millions of years (MY).
Mostly, it’
s been much warmer, with much higher CO2 levels.Eons ago, vast lava eruptions (Siberian Traps, etc.) put lots of CO2 in the air.When continents collided & mountains rose, rock weathering speeded up.This removed CO2 from the air, into silt & then the oceans.Himalayan weathering has driven CO2 levels down for some 50 MY.Algae, plants and seashells also removed CO2 from the air,making coal, oil, gas & limestone, as conditions permitted.CO2 levels were lower than today’s during ice ages over the past 2 MY. Small variations in Earth’s tilt, and how round its orbit is, drive their timing.Solar changes* affect Earth’s temperature. .So do Earth’s natural cycles, like El Niño / La Niña. . .Still, summer 2012 was hot, as was summer 2011. .Will this become the new normal?Climate is changing 15-30 faster than than the old record, eons ago.
* sunspot cycles.
the sun slowly brightens,
warming Earth more,
by ~2ºC / 100 MY.
Also,Slide3
Summary .
Earth’s 100-year surface warming rate
is 7-30 x the previous record.
The last times CO2 hit 400 ppm(~4 and 14 million years ago),Earth’s surface was ~7º and 10ºF warmer than nowand seas were 65 to 135 feet higher.Kansas was Las Vegas hot &Florida was mostly under water.We should stop putting carbon in the air&remove carbon from the airas fast as we put it in now.Slide4
An estimated 39% of global surface warming over 1975-2016
came from
albedo
(reflectivity) changes –direct plus amplification by water vapor & cloud feedbacks.fewer sulfur emissions: 22%earlier snow melt: 11%shrinking sea ice: 6%& land ice loss: 0.1%.How will albedo effects produce so much warming?
Warming to 2100 and beyond will be dominated byalbedo changes and their feedbacks:62-79% of 21st century warming and 67-100% of 22nd to 24th century warming,
unless we remove most of the CO2 we’ve added.Less sunlight reflected (more heat absorbed) was due toSlide5
So What?
Pay farmers,
ranchers, and
others to movecarbon from the air back into soils, underground, etc. Why?We already have way too much CO2 in the air. Earth will warm 3-4 x more, phasing out coal’s sulfur emissions (about 0.6ºF over 30 years), vanishing polar sea ice (~ 1.0ºF over 70 years [North] to 400 [S]), receding northern snow cover (~1.3ºF by 2400), receding Greenland & Antarctic ice (~0.6ºF by 2400
), warming oceans enough so energy out = in (~0.4ºF by 2400), & more water vapor & less cloud
cover (1.68 multiplier). No CO2 peak till 2035 adds 2.9º from the added CO2, 1.7 from snow, 1.6 from permafrost, 1.4 from H2O vapor & 1.5 from the other factors.---------------------------------------------------------------------------------------------------------------------------------------------------------------------------------------------------------------------------------------------------------------------------------------------------
So…give every American a $300 carbon tax refund Pay for it with a 2¢ / lb carbon tax,
even if we stop emitting now.
Blame
rising 15% / year.
each year.
Carbon neutral is no longer enough.Slide6
Rain Becomes More Variable .
Rainfall becomes more variable.
Wet areas tend to get
more rain than now.Dry areas tend to get rain less often than now.Around the Arctic gets lots more rain(&, at 1st, more snow, then less), butmid-latitudes (20 to 45º) tend to dry out.Worldwide, we get a little more rain, .except around the Arctic, we getmore hours and days without rain.In other words,we get more downpours* and floods,yet also longer‡, drier, hotter droughts.but
‡ +2.6% / ºF* +3.9% / ºF
WATERSo What?Slide7
Droughts Worsen .
Droughts Worsen
.
Deserts Spread.The Culprit?EvaporationSlide8
Greenhouse Effect
Greenhouse gases in the
air (GHGs) intercept some
outgoing radiation andre-radiate it back down.This warms Earth more.More GHGs = warmer still.Dark Earth absorbs sunlight.Earth warms up andradiates heat.
Light surfaces reflect sunlight. Those surfaces don’t warm Earth much.
Changing a light surface (ice) to a dark one (water) warms Earth.
Changing a dark surface (forest) to a lighter one (desert) cools Earth.Cyclic changes in solar output have warmed and cooled Earth modestly.By now, human GHGs warm Earth much more than solar changes do.Slide9
Greenhouse Gases
•
GHGs
warm Earth by 33ºC (60ºF).Earth’s surface would average 0ºF without them.• Water vapor (H2O) does 2/3 of this warming. Its concentrations vary many-fold over time and space. As Earth warms up, evaporation increases H2O in the air. This amplifies warming from other GHGs a lot. So, scientists often treat H2O not as a GHG, but a feedback for other GHGs.Still, more water in air 1ºC warmerwarms Earth 1/2 as much as GHGs added since 1750.Carbon dioxide (CO2) does 52% of the remaining net warming. Almost all US CO2 comes from burning coal, oil & natural gas. Per unit of energy, coal emits 4 units of CO2, oil 3, natural gas 2.Methane (CH4, natural gas) does 30%. leaky oil & gas wells & pipes, permafrost, coal mines, wetlands, cows, rice, landfillsCFCs (old air conditioners, ozone hole) do 7%, other gases 6%.
Black soot adds 20%, but aerosols (sulfates+) subtract 30%.
nitrous oxide (N2O, fertilizers) 5%,
(20% direct, 10% indirect: O3, H2O) Slide10
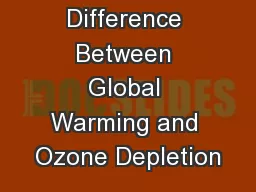
Vostok Ice Core Data .
Vostok Ice Core Data
For 100s of 1,000s of years, temperatures and levels of GHGs CO
2 and CH4 in the air have tracked each other closely. The difference between 190 and 280 ppm of CO2 was 10ºC (18ºF) at Vostok and ice almost a mile thick covering Chicago. Warming led CO2 & CH4 increases by centuries, moving carbon from soil, permafrost and the oceans into the atmosphere. Vostok data trends say that 400 ppm CO2 yields 4.5-7.8ºC warmer there than now. Are lag effects on the way?
Thousand Years before Present
Vimeux, Cuffey & Jouzel,Earth and Planetary ScienceLetters 203: 829-843 (2002)
∆
2015
+
ppm = parts per million ppb = parts per billion
•
+
2015
CO
2
level ~ 400 ppm
+
2015
CH
4
level ~ 1836 ppbSlide11
Lessons for Our Future from Ages Ago
For the ratio of the global average ∆
º
C to Vostok ∆ºC, I use 0.6, the ratio of global change to polar, over the last 2 million years, from Snyder (2016). With current CO2 & CH4 levels, the equations yield global surface warming of 8.3ºC, but only 4.9ºC if CH4 is neglected.Warminghow fast?
40-50% in decades,the rest over centuries.
(10 K year resolution)
4.0 - 4.2 Mya
14.1 -
14.5
Mya
-110.7 + 11.23 * LN (CO
2
)
+ 7.504 * LN (CH
4
)
-107 + 19.1 * LN (CO
2
)
Vostok
typical
ppb CH
4
for ppm CO
2
: 2.13 x
9.0
7.2
5.4
3.6
1.8
0
-1.8
-
3.6
-5.4
Est.
Global
∆
º
C
from 1951-80
384 461 554
CH
4
today
~
1840
ppb
.846
.773
R
2
for Vostok
400 ppm in 2015
0 - .420 Million years ago
Estimating ∆
º
C at Vostok
ppb CH
4Slide12
Global Surface ∆°C = 0.6 *
(
-110.7 + 11.23 * LN (CO
2) + 7.504 * LN (CH4))+2ºC globally requires (e.g.)
317 ppm CO2 and
694 ppb CH4.
This means removing 70-75% of the CO2that humans have emitted,
and all of our CH4.Humanity’s remaining carbon budget
for burning fossil fuels is about
NEGATIVE
310 GT
of
carbon.
any future CO
2
emissionsSlide13
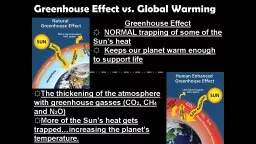
CO2
Levels in the Air
,
300 ppm(maximum betweenice ages)AnnualAverages
Up47%
•
highest level since 14-15 million years ago (430-465 ppm) Tripati ‘09
The deep ocean then was 10ºF or more warmer. Shevenell ‘08
8
ºF warmer world makes dry
Kansas
summers
hotter
than Las Vegas ones now.
We face BIG lag effects.
Seas
then
were 80-130 feet higher.
(40%
Since 1880)
CO
2
levels were
almost
as high (357-405 ppm) 4.0 to 4.2 million years ago.
Sea surfaces then were ~ 7
º
F warmer.
Csank
’11, Dwyer ‘08
Seas then were 65-120 feet higher.
This means ice
then
was gone from almost all of Greenland,
most of West Antarctica, and
some of East Antarctica.
Current
CO
2
levels are
already
too high for us.
Sediments show East Antarctic ice
then
retreated 100
s of km inland.
Vostok ice cores suggest a 8
º
F warmer world at 400 ppm
.
2/3 of West Antarctic ice is grounded
below
sea level.
So is 1/3 in the East.
(CH
4
up
114%
since 1880)Slide14
Only a tiny fraction of warming (
purple
) goes into the atmosphere.Slide15
Heat
Content (10
22
Joules)1022 Joules =100 years ofUS energy use, at2000-13 rate
By now, the oceans gain about as much heat every 3 years as ALL the energy humans have EVER used.
1991-2005 +0.7 /
1967-1990 +0.4 x 10²² Joules / year
2006-2016 +1.0 /
= 17 x human
use
acceleration
ISlide16
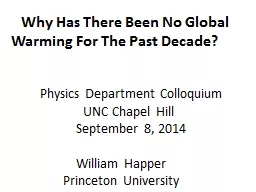
Sun vs Temp .
- NASA
- World Radiation Center
Watts / m2
ƼC
Solar Irradiance at Earth Orbit, Annual AverageIn 2007, solar output was the lowest yet recorded (in 28 years), but
Global Air Temperature, Land Surface, 3-Year Moving Average
Earth’s air temperatures (land surface) were the highest yet recorded.
∆
º
CSlide17
Clouds .
•
Half
the sunlight reaching our atmosphere makes it to the surface. Barriers include blue sky (not black), Clouds• Clouds reflect some sunlight away, cooling Earth. They also keep outbound heat in, warming Earth, esp. at night.• Many factors affect cloud formation & distribution. At night & going up over mountains, air cools. Cool air holds less H2O,Clouds cover a little more than half of Earth.Low clouds cool Earth more than they warm it;Changes in cloud area, altitude & opaqueness affect global temperature. Earth’s cloud cover area is shrinking a little, for a warming trend. We get more high clouds & fewer low ones, for a warming trend. Low clouds are growing more opaque, for a cooling trend. The net result is a warming trend: 10% of the total warming trend.
so it will often cloud up & rain.clouds, haze & the ozone layer.
On balance, they cool
it.high ones do the reverse.Slide18
Sulfates &
Cooling
Dark sulfates in the air block sunlight.
Sulfates make hazeMore sulfates = cloudier = cooler.Most sulfates come from burning coal,SO2 goes up the smokestacks.GHGs stay in the air many years,GHG levels keep rising.Sulfates now offset 30% (formerly 40%) of GHG warming:As we stop sending up SO2,That cools Earth.
& become cloud condensation nuclei.some from volcanoes.
It changes to SO4 (sulfate) up in the air.
sulfates usually for days.
Sulfate levels don’t.0.5ºC.
warming will catch up.Slide19
Predicted ∆°C
= -20.51 + 2.223 * LN (CO
2
ppm) + 1.133 * LN (CH4 ppb) - .00319 * SO4 ppbSO4 data includes industrial, occasional large volcanic, and other natural emissions.
Sulfate Cooling Un-Smooths GHG Warming
sulfates still3 x 1880 levels
adjusted R2 = 97.8%. CO2, CH4 & SO4 (also 5-year averages (SO4 lag 1 year
)) are all highly significant (|t| = 9.7 to 11.6).+1.8ºC
NASA
Krakatoa
Santa
Maria+
Katmai
+
Agung
Pinatubo
Averages:
80
(
100
now)
8
(episodic)
30
human 2016 sulfur emissions
down 23% from 1979 peak
human sulfur emissions up
110% from 1940 to 1970
Predicted ∆°C, w/o Volcanos
= -20.48 + 2.089 * LN (CO
2
ppm) + 1.252 * LN (CH
4
ppb) - .00393 * SO
4
ppb
adjusted R
2
= 98.3%. CO
2
, CH
4
& SO
4
(also 5-year averages) are all highly significant (|t-ratios| = 6.4 to 8.7).
cool
coolSlide20
Air at the land surface has warmed
~1/3 faster than the sea surface.
Air warms more when & where it
’s coldest:in winter,at night,& especially toward the poles:10% faster than the global average at 40-45ºN,100% faster in the Arctic.Air in dry areas warms faster than wet areas.Heat evaporates water if available;otherwise it warms the air.Since 1995, Kansas warmed at 1.44 x the US rate.Even without more CO2,Kansas summers will become Las Vegas hot.1.25 * 1.1 * 1.44 * 1.8 (ºC to F) = 3.6ºF warming in Kansas for each 1ºC worldwide.Slide21
The 2010-2020 rate of change is
At that rate, “Both” will exceed
2
ºC above 1880 levels in 2048.
“Land” in 2031.
3.3 for Sea,
3.3 for Both.
3.7 ºC / 100 years for Land,
+1.23
º
C
in 100 years
NASA
, 5-year moving averageSlide22
Earth Is Heating Up.
Earth now
absorbs
0.33% more energy than it emits – a 450 million MW heat gain. 450 million MW This absorption has been accelerating, from near zero in 1960.Earth will warm another 0.3ºC or more .just so it emits enough heat to balance absorption.Air at the land surface warmed 1.4ºC (5-year average) in 100 years, 1.2ºC in the last 50 (1.6ºC since 1880).• Air at the sea surface warmed 1.2ºC in 100 years About 90% of the energy Earth absorbs heats the oceans.
If it all went to melt Greenland ice, the ice would vanish in 30 years. .The oceans have gained > 10 x more heat in 40 years than ALL
the energy humans have EVER used.
One MW can power several hundred US homes.~ means “approximately, roughly, is about equal to”
1ºC = 1.8ºF.
=
30
x human energy
use
.
(±60 million MW)
=
70
x
global
electric supply
, so far,
, 0.
9
º
C in the last 50.Slide23
Map of 26 US Places .
Consider 41 years of US daily high temperatures, June thru September,
1975-2015, in 26 places scattered around the US.
Jointly, these places have gained very few people since 1980 (0.03%/year),while US energy use per person shrank 0.28% per year. .Thus, urban heat island effects in these places actually shrank. .• BartowMacon •
•
Tupelo
•Houma
Waco •
Roswell
•
•
Yuma
•
Hanford
•
Oakland
•
Astoria
•
Butte
•
Aspen
Norfolk
•
Duluth
•
Moline
•
Evansville
•
Saginaw
•
•
Baltimore
Boston
•
•
Newark
•
Hampton
Bristol
•
Canton
•
Rolla
•
Elmira
•
•
EnidSlide24
US Warming Graph .
At +5.4
º
F / century, in 2100 summer in Salina would be as hot as Dallas now.Warming at 10.0ºF / century, in 2111 it would be as hot as Las Vegas now.We should PREVENT this.
+
5.4ºF / century trend
+1.3ºF /century
+10.0ºF /century
Consider Salina, Kansas,
in the heart of wheat country,
breadbasket of the world.
3-Year
Moving Average
Over 1995-2015, Salina actually warmed 50% faster than the 26-city average.
Hot as Las Vegas in 2088.
•Slide25
Years till Las Vegas .
The analysis was extended to 330 places across 48 contiguous states:
5.8ºF / century over 1975-2015 and 10.5ºF / century over 1995-2015.(Compare to 5.4º and 10.0ºF / century for the 26 places.) Summer warming was slowest in the East North Central states. It was fastest in the Rockies, S. Atlantic (x Florida) & southern Plains states.Slide26
When Do State Summers Become as Hot as Las Vegas Now?
The average of daily highs in Las Vegas, June 1 thru September 30, 1995-2015, was
100.1
ºF.Dates shown assume LOCAL daily high trends for those 21 years CONTINUE.Trends use 21 years x 122 days, for 348 places.•
2052
2070
2083
2086
2097
2095
2096
2099
2101
2104
2108
2117
2125
2129
2135
2194
2137
2140
2155
2164
2169
2194
3649
2191
2245
2253
2287
New
England
2322
2348
2362
Dakotas
2315
2266
2252
2567
2483
2181
2371
2162
2128
2145
2149
2235
MD-NJ-DESlide27
Heat in the Heartland,
sponsored by Bloomberg, Paulson &
Steyer, Jan. 2015 Las Vegas had 114, 99, and 115 days above 95ºF over 2012-14. If current emission trends continue, there is a 10-20% chance some orange area will be hotter than Las Vegas by 2100. Humidity and much more heat make Midwest heat stroke conditions skyrocket. 3 days a year would be worse than any ever experienced anywhere in the US.
Crop losses of 40-64% by 2100 are likely for corn in the Corn Belt (IA, IL, IN, OH, MO) and 8-38% by 2100 for soybeans in the same states. Winter wheat is barely affected.
if current emission trends continue
if current emission trends continue
if current emission trends continue•
Over 100 years, Midwest summers can grow 10-12
º
F hotter.
Missouri, Illinois & Indiana grow hotter than Texas now.
Iowa & Ohio get
as
hot.
Michigan warms the most.
It gets
Arizona hot.
24-hour average
daily highsSlide28
Tipping Points
Report to US & British Legislators
-
January 2006in the US, to Senator Olympia Snowe (R-ME)What would make climate change accelerate, so natural forces defeat our efforts to slow it?Disappearance of sea icemeans more heat is absorbed by the water below.Carbon sinks fade in oceans & forests. Some become carbon sources.3 Methane release from permafrostrevs up warming in a vicious circle. Slide29
Hurricanes
Hurricanes
convert ocean heat to powerful winds & heavy rains. Intense hurricanes are becoming more common. Higher hurricane energy closely tracks sea surface warming. Stronger hurricanes bring higher storm surges and worse floods.
More Heat - So?
Emanuel, 2005
weakest
strongest
Webster, 2005
•
All Ocean Basins Combined
East of Caribbean, west of Africa
6-18
º
N, 20-60
º
W
ºSlide30
Carbon in the Oceans
1/4 of our carbon emitted has gone into the oceans.
Added carbon has made
oceans 30% more acidic .(Oceans are adding acid 100 times faster than in a million years.)As a result, creatures find it ever harder to extract calcium from seawater to build shells.Consider corals.Reefs of coral shells support myriad species, many billions of fish.Already, 60% of corals cannot form shells.At current rates, by 2100 ocean acidity would double or more.No corals could form shells and reefs would all erode away. Warmer water holds less dissolved oxygen.Fish & mollusks suffer.The mix of sea creatures will change, a lot., so far.Slide31
Reservoirs in the Sky
Most mountain
glaciers
dwindle ever faster:in the Alps, Andes, Rockies, east & central Himalayas.65% of the latter shrank from 2000 to 2008, including 80% in Tibet.30% of Himalayan glacier ice vanished since 1980.When Himalayan glaciers vanish, so couldthe Ganges River (Indus, Yellow, etc.) in the dry season,when flows already are only a few % of average.When Andes glaciers vanish, so doesmost of the water supply for Lima and La Paz.Mountain snows melt earlier.CA’s San Joaquin River (Central Valley, US “salad bowl”) could dry up by July in most years.The Colorado River’s recent 16-year drought was the worst since white men came... World’s forest fires burned 6+ x as much area / year as before 1986. .
No seedlings were growing back at 1/3 of 1,500 fire sites in Rockies.US West’s forest fire area burned will rise 2-7 x / 1ºC warmer.Slide32
Earth’
s Thermostat
.Arctic Ocean ice is shrinking fast.. Minimum ice area fell 49% in 37 years, The bright ice could melt away by fall in 4-9 years The dark water absorbs far more heat than ice: .Greenland’s net ice-melt rate rose 7 x in the past 17 years.So, the ice cap’s simple life expectancy fell from 60 millennia to 8.Its annual net melt-water is already 1/2 of US water use.Antarctica’s yearly net ice-melt (W minus E) was ~ 1/3 of Greenland’s. Its melt rate tripled over 2007-17. . Seas will likely rise 1 to 7 feet by 2100Seas rose 5 feet / century from 13,000 to 6,000 BC.
& be gone all summer in 9-30.
while volume fell 73%
, 50% in the last 10.
It has 9 x the ice.
It will last longer.
U of Bremen
The ice got
thin
ner too.
so far, like 20 extra years of CO
2
.
PIOMAS
U of Washington
As the ice recedes,
Earth absorbs more heat.
It will warm more,
even without more CO
2
.
& 100+ feet over centuries.
Wipneus
•Slide33
Methane Tipping Point?
Thawing Arctic permafrost holds
5 x MORE carbonthan ALL the carbon humans have emitted from fossil fuels.In fact, it holds 2 x as much as Earth’s atmosphere.Permafrost area shrank 7% from 1900 to 2000.It may shrink 75-88% more by 2100.Already, Arctic permafrost emits ~ carbon as all US vehicles.Part emerges as methane (CH4), changing to CO2 over the years.Thawing permafrost can add ~100 ppm* of CO2 to the air by 2100,and almost 300 more by 2300. Seabed methane hydrates may hold a similar amount,
but so far they are releasing only 20-30% as much carbon. There may be far more permafrost carbon under Antarctic ice.55 million years ago, .from thawed Antarctic permafrost .warmed Earth by 6ºC over 4-10 K years, far more over the Arctic Ocean.
Warming now is 7-35 times as fast as then. * 100 ppm~ ppm fromfossil fuelsto date.
scads of carbon& later CH4 hydratesSlide34
Bio Impacts
To escape heat, species move toward the poles and up mountains.
But some species cannot move fast enough.
Habitat for many vanishes entirely.Cold-blooded species move around faster, warm-blooded ones slower. More lizards, snakes, mosquitoes and beetles, fewer mammals. Some places get too hot and humid for humans to survive.Earlier springs set up timing mis-matches between flowering green plants and herbivores, and between prey and predators.Warmer weather dries up forests. They catch fire and burn much more.Tropical diseases, mosquitoes, ticks, etc. expand their ranges.Coral bleachings come more often and harder. Earth’s coral reefs vanish.More acid oceans make it harder from creatures to form shells.Extinction rates are already 100s of times background rates.Slide35
Hot &
Dry
From 1979 to 2005, the tropics spread. .Sub-tropic arid belts grew ~140 miles toward the poles, .a century ahead of schedule. .That means our jet stream moves north more often.In turn, the US gets hot weather more often.With less temperature gradient between the Arctic & mid-latitudes,the jet stream slows and meanders N-S much more: 1-2 K miles. . hot dry air lingers longer (heat waves)2011-12 was America’s hottest on record..Over September 2011 - August 2012, relative to local norms,33 states were drier than the wettest state (WA) was wet.
Over 2012, 44 of 48 states were drier than normal. Severe drought covered a record 35-46% of the US . Drought reduced the corn crop by 1/4. .The soybean crop was also hit hard.The Mississippi River neared a record low
.. What Else?
, for 39 weeks.Record prices followed.Lake Michigan-Huron hit one.
, as does moist rainy air (floods).SoSlide36
Notable Recent Droughts .
When I was young, the leading wheat producers were the
US Great Plains, Russia’
s steppes, Canada, Australia, and Argentina’s Pampas.Notable Recent Droughts.When Where How Bad2003 France, W Europe record heat2003-10 Australia worst in 900 years.2005 Amazon Basin once a century. 2007 Atlanta, US SE once a century2007 Europe: Balkans record heat, Greek fires,‘07-9 California record low rains.2008-9 Argentina worst in half a century2008-11 north China ~worst in 2 centuries.2009
India Monsoon rain down 10-20% in N & C-E (1901-2012).2010 Russia record heat, forest fires.2011 Texas, Oklahoma record heat & drought2012
US: SW, MW, SE most widespread in 78 years; record heat
China now #1 in wheat.
#2 in wheat
15K die.
Wheat prices up 75%.
, 20-70K die.
Record
heat in 2013.
hundreds die.
US #3 now
hotter
in 2012
Drought
worst
in 900+ years.
Worse
in 2010
“Once a century” droughts are now happening once a
decade
.
1998-2012 Syria, Iraq
, Jordan+
10% worse than any other in 900 years
Severe
in Yunnan ‘09-13.
& esp. 2013-16.
,
‘13-15Slide37
from 0.5% of today’s
Groundwater
.
Over 1994-2007, deserts grew from 18 to 27% of China’s area. .Desert growth is worse where the Sahara marches into Africa’s Sahel. . Yearly US groundwater withdrawals (irrigation +) grew, water use, before 1950, 1/5 of wheat is irrigated in the US, 3/5 in India, 4/5 in China. .Central CA loses enough to irrigation yearly to fill Lake Erie in 100 years. .India’s Ganges Basin loses enough groundwater yearly to fill Lake Erie in 10. .With more evaporation & irrigation, many water tables fallWorldwide, irrigation wells chase water ever deeper. . Many wells in China & India wheat belts must go down 1,000 feet for water. .Since 1985, half the lakes in Qinghai province (China) vanished. . 92%
in Hebei (around Beijing), Inland seas and lakes dry up:. . Lake Mead water fell 133 feet over 2000-15. Lake Michigan-Huron hit a record low in 2013, Lake Baikal in 2015. More rivers fail to reach the sea:
Water
3-20 feet a year.
Aral & Dead Seas, Lakes Chad & Eyre.as water tables dropped below lake beds.Water prices rise.
So, the Ogallala Aquifer, etc. dwindle.
Yellow
,
Colorado
,
Indus, Rio Grande, etc.
No
Is That All?
50/50 it
’
s too low to use by 2021.
to 5.4% now.Slide38
Carbon Sinks Fading?
Severe
drought
hit 45% of North America in 2002, so plants absorbed 50% less CO2.The Amazon Basin’s 2010 drought turned its rainforest into anet carbon source for the year.Its emissions exceeded China’s .2016 was worse in the Amazon – and the Congo and Indonesia. Things will likely get worse this century, as tropical rainforests dry out.Since 1979, Amazon dry seasons grew longer by 1 week / decade.Its trees hold 1/4 of carbon in fossil fuels burned to date: ~25 ppm.Sea surfaces warmed 0.15ºC over 1997-2004, soplankton absorbed 7%
less CO2. Warming was far strongest in the North Atlantic.CO2 uptake there fell by half
.However, the % of the carbon we emit that stays in the air hasn’t risen.Temperate and sub-Arctic forests have taken up more carbon.- for the 2nd time in 6 years.Slide39
Phytoplankton .
Phytoplankton
levels in the oceans perhaps
.fell 40% since the 1950s: . Findings are based on opacity of near-surface water.D. Boyce, M. Lewis, B. Worm, Nature 4/28/10 . Phytoplankton declined 30% in the Indian Ocean since 1999.Roxy, Modi, Murtugudde, et al., 1/19/16, using satellite chlorophyll data . But 111 years of ocean green color data shows no global trend;the north Atlantic grew greener, Pacific & Indian grew less green.M. Weynand et al., PLOS 2013 .1 The tiny phytoplankton form the ocean food web’s base.2 Warmer layers on top inhibit cold water below from rising. Less turnover brings fewer nutrients up for plankton growth.3 Plankton absorb CO2
. Perhaps not so much any more.4 They have supplied half the world’s oxygen. Earth has a 2,000-year oxygen supply, always being refreshed.
1% / year since 1979.Slide40
Turning Wheat into Cactus .
In 2005-6, scientists calculated how climate would change
for 9 Northeast and 6 Great Lakes states in 2 scenarios:
#1 - a transition away from fossil fuels, or #2 - continued heavy reliance on them (business as usual emissions).By 2085,averaged across 15 states, the climate change would be likemoving 330 miles to the SSW (coal & oil use dwindle), ormoving 650 miles to the SSW (heavy coal & oil use).Consider central Kansas, heart of wheat country.330 miles to the SSW lies the area from Amarillo to Oklahoma City.650 miles to the SSW lies the area around Alpine & Del Rio, TX.2 people / square mile. Cactus grows there.Mesquite & sagebrush too.No wheatSlide41
UN Chief on Climate Change .
Some scientists are saying publicly that if humanity goes on with business as usual, climate change could lead to the
collapse of civilization
, even in the lifetime of today's children.UN Secretary General Ban Ki-Moon answered “I think that is a correct assessment.” He added carefully “If we take action today, it may not be too late.”September 24, 2007Continued emission of greenhouse gases will cause further warming and long-lasting changes in all components of the climate system, increasing the likelihood of severe, pervasive and irreversible impacts for people and ecosystems.IPCC Synthesis Report: November 1, 2014UN secretary general, António Guterres, attacked fossil fuel subsidies, said: “What we are doing is using taxpayers’ money … to destroy the world.”May 2019Slide42
By 2059, “Once a Century” Drought Can Cover 45% of Earth.
1969
Supply-Demand Drought Index 1999 . Business .. as Usual . Emissions. .2029 2059
DRY
WET
0 1 5 16 36 36 16 5 1 0% Occurrence in Control Run
in 2059 2 x CO2
Fig. 1 in David Rind, R. Goldberg, James Hansen, Cynthia
Rosenzweig
, R.
Ruedy
, “Potential Evapotranspiration and
the Likelihood of Future Droughts,”
Journal of Geophysical
Research
, Vol. 95, No. D7, 6/20/
1990
, 9983-10004.
Climate Model:
NASA
Goddard
Institute for
Space Studies
(GISS)
+4.2
ºC
+14% rain
•
•
•
•Slide43
Projected Droughts by Year .
Fig. 2 in Rind
et al.
, 199016%5%1%}
Occurrence in Control Run
Over 2000-04, the average frequencies are 18% for “Drought“ and 33% for “Dry”.A weighted average for “as dry as 11% of the time” drought is ~ 27%.
Based on Supply-Demand Drought Index
2xCO2
2x
CO
2
“Once a century” drought can cover 45% of Earth’s land by 2059.
Projected
Drought
Conditions
Land Surface
,
except Antarctica
June-August,
Business as Usual Emissions
•Slide44
Droughts Are Spreading Already.
Earth’s area in
severe
drought has tripled since 1979.Area where rain is scarceincreased by quite a bit:3-6 million square miles.
Evaporation increased,by a lot since 1987.
from Fig. 9 in Aiguo Dai, Kevin E. Trenberth, Taotao Qian [NCAR], "A Global Dataset of Palmer Drought Severity Index for 1870-2002: Relationship with Soil Moisture and Effects of Surface Warming.” Journal of Hydrometeorology, December 2004, 1117-1130
10 million moresquare miles
Evaporation at work
Compare 30%
actual
severe drought
area in 2002 (11% of the time during 1951-80) to
27
%
projected
for 2000-2004 in previous slide.
Over 23 years, the area with
severe
drought
grew
by the size of North America.
Compare 2002
to 1979.
combined effect
Droughts
spread,
as projected
or
faster
.
11% of the area during 1951-80:
once per 9 years
•
30% = 16 million square miles
Switch from what
could
happen to what
has
happened already.
º
ºSlide45
Very Wet Areas .
The combined decrease was 6% from 1979 to 2002,
but only 3% from the 1950-80 mean to the 1992-2002 average.
During 1950-1980, the precipitation effectmade 11.2% of areas very wet. Cooling(1957, ’66, ’77, ‘79) kicked that up to 11.5%.Once per 9 years.Rainy area shrank & grew.
combined effect: decrease 3-6% (1-3 million square miles)
Evaporation increased.
Compare 2002to 1979.Over 23 years, the soggy
area shrank by the size of India, more or less.•
20% = 10.6 million square miles
º
ºSlide46
RECAP
Severe
drought has arrived, Severe drought now afflicts an area the size of Asia.So, farmers mine groundwater ever faster for irrigation. From 1979 to 2002 (+0.5ºC) . 1) The area where rain is scarceincreased by the size of the United States.Add in more evaporation. . 2) The area with severe droughtgrew by the size of North America. 3) The area suffering severe
drought tripled. 4) The similarly wet area shrank by the size of India.
as projected
or faster.Slide47
What Drives Drought?
The water-holding capacity of air rises
exponentially with temperature.
Air 4ºC warmer holds 33% more moistureat the same relative humidity. (That’s the flip side of “air cools. More moisture in the air does not equal more clouds.To maintain soil moisture,~10% more rain is required to offset each 1ºC warming.Warmth draws more water UP (evaporation), soless goes DOWN (into soils) or SIDEways (into streams).More water is stored in the air, less in soils.Satellites are already showing more water vapor in the air.Not quite all the water that goes up comes back down.
It holds less H2O, so it clouds up & rains.
”)Slide48
Droughts - Why Worry? .
Droughts - Why Worry?
2059 - 2 x CO2 (Business as Usual Emissions) .More moisture in the air, Average US stream flows decline 30%, Tree biomass in the eastern US falls by up to 40%.More dry climate vegetation: The vegetation changes mean• Biological Net Primary Productivity falls 30-
70%.SWITCH from PROJECTIONS to ACTUALS. .• Satellites show browning of the Earth began in 1994. .
but 15-27% less in the soil.
despite 14% more rain.
savannas, prairies, deserts
Angert 2005
Zhao 2010
Rind
et al
., 1990Slide49
Crop Yields Fall
.
United States: 2059 Projections - doubled CO2 - Business as Usual Great Lakes, Southeast, southern Great PlainsCorn, Wheat, Soybeans2 Climate Models (Scenarios) .NASA GISS Results Goddard Institute for Space StudiesYields fall 30%, averaged across regions & crops.NOAA GFDL Results Geophysical Fluid Dynamics LabYields fall 50%, averaged across regions & crops.CO2 fertilization not included . Temperature effects of doubled CO2
will grow to 4.2 or 4.5°C after 2060, but continue to grow afterward, past 8°C by 2400, as positive feedbacks continue to amplify direct effects. CO2 fertilization (2 x CO2) boosts yields 4-34% in experiments, where water and other nutrients are well supplied, and weeds and pests are controlled. That won’t happen as well in many fields. Other factors (esp. nitrogen) soon limit growth, so CO2 fertilization will falter. Besides, with higher CO
2, plants make more carbs but less protein.
Rind et al., 1990
- 3 of the big 4 crops (rice is the 4th)
(based on 4.2°C warmer, 14% more rain)
(based on ~ 4.5°C warmer, 5%
less
rain)Slide50
Photosynthesis & CO2
.
Plants
evaporate (transpire) water in order to[like blood]get it up to leaves, where H2O & CO2 form carbohydrates,pull other soil nutrients up from the roots to the leaves, and[like sweat]cool leaves, so photosynthesis continues & proteins aren’t damaged.When water is scarce, fewer nutrients (nitrogen, phosphorus, etc.) get up to leaves.With more CO2, leaf pores narrow, so less water evaporates.This slows water loss in droughts.But it also heats up leaves, harming plant growth when it’s hot.So, with warming, more CO2, and less water, leaves make more carbohydrates, but fewer proteins.Slide51
Warming and Falling Yields .
Warming (
’
92-03) cut Asian rice yields by 10+%/ºC.Warming (’82-98) in 618+ US counties cut corn & soybean yields 17%/ºC.With more CO2, 2ºC warming cut yields 8-38% for irrigated wheat in India.Warmer nights (’79-’04) cut rice yield growth 10%± in 6 Asian nations.Warming (’80-’08) cut wheat yield growth 5.5%, corn 3.8%.Crop yields rise with some warming, but fall with more warming. Warming helps crops in cool areas, but hurts in the tropics.For 1ºC warming, with no change in weeds or pests, in generalUS corn yields fall 8%, rice 10%, wheat 5-7%, soybeans 3%.Add CO2 (440 ppm) fertilization and irrigate .
US corn & rice yields fall 2%, wheat rises 2%, soybeans 5-9%.But weeds and pests also grow better with warming & more CO2.For wheat, corn & rice, photosynthesis in leaves slows a lot above 95ºF and stops above 104ºF [40ºC].
Tropical areas suffer most:e.g., irrigated rice yields can fall 30% by the Ganges., if POSSIBLE (not too costly).Slide52
Heat Spikes Devastate Crop Yields
Heat Spikes Devastate Crop Yields
Schlenker & Roberts 2009
.Based on 55 years of crop data from most US counties, andholding current growing regions fixed,average yields for corn and soybeans couldplunge 37-46% by 2100 with the slowest (#1) warmingand plummet 75-82% with quicker (#2) warming.Why?Corn and soybean yields rise with daily highs up to 29-30ºC [84-86ºF],but fall more steeply with higher temperatures.Heat spikes on individual days have BIG impacts.Other crop future models use average temperatures.Thus they miss heat spikes on or within individual days.More rain can lessen losses. Plants transpire more water to cool off.Growing other crops, or growing crops farther north, can help too.Slide53
World Grain Production .
80% of human food comes from grains.
World grain production rose little from 1992 to 2006.
Production per capita fell from 343 kilograms in 1985 to 306 in 2006.UN Food & Agriculture OrganizationWorldwatch Institute 2006•Slide54
Crop yields plateaued .
Million Metric Tonnes harvest by nation in 2011 (right column) are used to calculate weights.
Weighted average world grain yields per acre plateaued over 2008-12.
But they rose 7% in 2013, as the US rebounded to a record harvest, and grew slightly in 2014.The plateau is consistent with spikes in food prices, and with forecasts of falling crop yields.•Slide55
World Grain Stocks .
Any future food production increases will occur
away
from the tropics. In the tropics, food production will fall.Soil erosion continues. Water to irrigate crops will grow scarcer, as glaciers and snowpacks vanish, water tables fall, and rainfall becomes more variable.Satellites show that, since 1994, hot dry summers outweigh warm, wet springs. A world that was turning greener
is now turning browner.Grain stocks (below) were at low levels.
FAO: Crop Prospects and Food SituationSlide56
Farm Adaptations to Drought
Plant more drought-resistant crops.
Plant smarter, like System for Rice Intensification.
the roots cuts fertilizer & pests, raises yields & drought tolerance.Plant crops that rebuild soil carbon.Use much more drip irrigation.Cover reservoirs and irrigation canals to slow evaporation.Plant more wheat, less rice. Rice is water-hungry.Go North, young man!Mexicans to the US,Pakistanis to Britain, Algerians to France, Turks to GermanyChinese to Siberia,Colonize Greenland. Americans to Canada,
Arabs to Russia,
With less food, feed fewer animals. Eat less meat.
Suck CO2 out of the air.
More space betweenSlide57
Food Price Index .
Poor people could not afford to buy enough food in 2007-8.
.
Malnutrition & starvation rose. Food riots toppled governments in 2011.UN, Food & Agriculture Organization: World Food Situation / FAO NewsWith food stocks at low levels, food prices rose steeply in 2007-8
and 2010.
Ditto 2010-11.
2002-04 = 100Slide58
Estimated Impact of +3ºC on Crop Yields by 2050
from Chapter 3 in
World Development Report 2010: Development and Climate Change
. by World Bank, One of many studies,more pessimistic than average.
for wheat, rice,maize, soybean& 7 other crops
Müller, C., A. Bondeau, A. Popp, K. Waha, and M. Fader.2009. “Climate Change Impacts on Agricultural Yields.”Potsdam Institute for Climate Impact Research
average of 3 emission scenarios, across 5 global climate models, no CO2 fertilization
citing•
40-50% decrease for Iowa & IllinoisSlide59
Deserts Are Already Spreading.
50 Year Trend in Palmer
Drought
Severity Index, 1950-2002The Sahara Desert is spreading south, into Darfur & the Sahel. .The Gobi Desert is spreading into northeast China. More sandstorms visit Beijing.Retreating glaciers moisten the soil in Tibet. .
75
604530150-15-30-45-60
Fig. 7 in Dai,Trenberth & Qian,Journal ofHydrometeorology,Dec. 2004
•
-6.0
-4.0
-2.0
0.0
+2.0
+4.0
+6.0
-180 -120 -60 0 60 120 180
More
negative
is drier. More
positive
is
wetter.
See Spain, Italy, Greece.
The
USA
lucked out till 2007.Slide60
2º
vs
4° Warming . 1.2ºC warming is here. 2ºC warming is unavoidable, absent MASSIVE CO2 removal.Holding warming to 2ºC, not 4º, prevents these losses:3/4 of Gross World Product $42 Trillion ~ 3/4 of GWP 1/5 of the World’s Food .2/3 of the Amazon Rainforest1/8 of the world’s oxygen supplyGulf Stream +
West Antarctic Icecap .Florida & Louisiana, central CA, Long Island, Cape Cod1/2 of all Species . 4ºC
warming threatens civilization itself.Details to follow: first 2ºC, next 3ºC, then 4ºC, finally 5ºC.
5ºC is worse.Emissions
continue.3+ºC more is in the pipeline.
- Norfolk area, much ofSlide61
2º
C
Warming
. . Stern Review, British government, Oct. 2006 .(a report by dozens of scientists, headed by the World Bank’s chief economist) . selected effects - unavoidable damages, absent MASSIVE CO2 removal ASAP .Hurricane costs double. Major heat waves are common. Droughts intensify. Civil wars & border wars over water increase:Crop yields rise nowhere e.g., Brazil soy
yields fall 30-70%, wheat 50%, corn 60%. World Bank 2014Greenland icecap collapse becomes irreversible. If we play it right, melting takes 3,000 years.The ocean begins its invasion of Bangladesh. It lasts for many centuries. We choose now
how fast and how far.CNA Corp. – 11 retired US Generals & Admirals, April 2007
Many more major floods
Forest fires worsen.
Deserts spread
.
more Darfur
’
s.
If we play it wrong, 300 years.
&
fall
in the
tropics
.Slide62
3ºC
Warming
additional
damages – may be delayed or avoided with MASSIVE CO2 removal . Droughts & hurricanes get much worse.Hydropower and irrigation decline. Crop yields fall substantially in many areas.More water wars & failed states. 2/3 of Amazon rainforest may turn to savanna, desert scrub.Tropical diseases (malaria, etc.) spread farther and faster.15-50%
of species face extinction.
Water is scarce.Stern Review & CNA Corp.
Terrorists multiply.
Cox ‘00, Huntingford ‘08, Jones ‘09, Cook ‘10
Lyme disease, West Nile virus, dengue fever too. Etc.
Mammal extinction rates are already 200-500 x background rates.
World is on this pace for 2100.
Deforestation driving S
ão Paulo drought.
Nobre
‘14Slide63
.
4ºC
Warming
.. further damages - avoidable • Water shortages afflict almost all people.Crop yields fall in ALL regions, by 1/3 in many.Entire regions cease agriculture altogether, Water wars, refugee crises, & terrorism become intense. This has begun: Somalia, Darfur, Rwanda, south Sudan, Mali, north Nigeria, Syria, Iraq.Methane release from permafrost
accelerates more.The Gulf Stream may stop, monsoons sometimes fail. “Gulf Stream” is shorthand for the world ocean thermohaline circulation, to which it’s connected.West Antarctic ice sheet collapse speeds up.Adios to Miami, New Orleans, Norfolk & Venice by 2100,to Amsterdam, Bangkok, Canton, Kolkata, Saigon, Shanghai & Tampa by 2200.
Goodbye also to parts of New York, London & Washington, as seas creep higher.• At times in US SE, it’s too hot & humid to survive working outside long.Stouffer ’13, Sommer ‘14, Kopp ’15 .
Stern Review & CNA
e.g., Australia.
We played it wrong
.Slide64
5°C Warming .
5
º
C Warming .Deserts GROW by 2 x the size of the US. Eventually, we’d gain US-sized polar forestsMuch of southern Europe would look like the Sahara. Agriculture would be destroyed and life would be impossible,over much of the planet. Lord Stern, 2009World food falls by 1/3 to 1/2.The result? Extended conflict, social disruption, war essentially,over much of the world, for many decades. Lord Stern, 2009Human population falls . to match the reduced food supply.It won’t be pretty. World War 2 killed 60 millionOther species fare worse.The 6th Great Extinction has begun.
a lot,
US summer pace, by 2100, but we’d lose as much to rising seas.
, but worldwide, it did not reduce population.For perspective,
my extrapolationSlide65
The Stakes .
China faces
extremely grim
ecological and environmental conditions, under the impact of continued global warming and changes to China’s regional environment.China’s 2nd National Climate AssessmentDecember 2011 The costs of failing to tackle the climate change issue would be greater than the impact of both World Wars and the Great Depression combined. Once the damage from unchecked emissions growth is done, no retrospective global agreement, in some future period, can undo that choice. British Prime Minister Gordon BrownOctober 19, 2009Slide66
Costs
―––––––––––––––––––––––––––––––––––––––––––––––––––––––––––––––––––––––––––––––––––––––––––––––––––––––––––––-–––––----–––––––––––––––––
Costs of
Inaction: including $120 billion ($400 / American) in the US for 2012 .Already 0.5 million / year die worldwide, . $100 Trillion . This exceeds GWP. .Unchecked, by 2100 warming will cost, e.g., India 8.7% of GNP. Asia Development Bank 2014 a HUGE hidden TAX: $50,000 / American$85 / Ton of CO2―––––––––––––––––––––––––––––––––––––––––––––––––––––––––––––––––––––––––––––––––––––––––––––––––––––––––––––------––––––––––––––––––––––
Costs of Action: Spend 1% of GWP ($150 billion by US), each year, ± 2%. Damages fall to $25 - $30 / Ton of CO2.World Savings
~ $2.5 Trillion, net from each year’s spending.
Stern Reviewinflation-adjusted $, Business
as Usual (present value
$9-75
/ year
/ American
– CBO, EPA
now
$695 Billion/Year
(more than 1% of GWP),
+4.5 million from coal sulfates.
(almost 1% of US GNP).
Costs
GROW
over time
.
DARA,
Watkiss / Hope,
annualized: $2 Trillion / year
(2%/year discount rate)
: 2005-2200)Slide67
2100
Soil carbon loss
since 10,000 BC
= 60% of fossilfuel emissions. Lal ‘01
CDR: CO2 removal= 32% of fossil fuel CO2 emissionsto 2010.
2xCDR: remove65% of FF CO2 emissions to 2010.CO2 Emission Trajectories .Slide68
CO2 ppm Trajectories .
ppm CO
2
from permafrost, etc. 450 339 220 142 66 54Slide69
Future Temperatures by Scenario
.
2100
Kansas is hot as Las Vegas is now
international target
includes big
albedo effects:
loss of sulfates; sea ice;some snow, cloudcover & land ice. More H2O in the air.Slide70
Sea Level Rise Futures .
2100
S Florida, Norfolk, Sacramento,
Baton Rouge, Trenton under water
includes thermal expansion& 86-99% ice loss (x CDR) In W. Antarctica, 74-96% (x CDR) in Greenland, & 7-35% (x CDR) in E. Antarctica.Slide71
Composite Effects of 6 Scenarios .
Composite Effects of 6 Scenarios
.
2100
2100
Kansas gets hot as Las Vegas is now
S Florida, Norfolk, Sacramento
Baton Rouge, Trenton under water
International target
Soil carbon loss
since 10,000 BC
= 60% of fossil
fuel emissions.
Lal
‘01
CDR
: CO
2
removal
= 32% of fossil fuel CO
2
emissions
to 2010.
2xCDR
: remove
66% of FF CO
2
emissions to 2010.
ppm CO
2
from permafrost, etc.
450
339
220
142
66
54
includes big
albedo
effects:
loss of sulfates, sea ice,
some snow, cloud
cover & land ice.
More H
2
O in the air.
includes thermal expansion
& 86-99% ice loss (x CDR)
in W. Antarctica, 74-96% (x CDR) in Greenland, & 7-35%
(x CDR) in E. Antarctica.Slide72
Solutions
Stop putting carbon in the air.
Take carbon out of the air,
big time.Maybe screen out sunshine too, temporarily.Slide73
Take Carbon Out
of the Air
.
1 Farming, done right, can add 1.5 - 4.3 GT C / yr to soil. Organic farms can add 1 T C / acre / year, Rebuild soil organic matter (carbon): Increase humus2 Farm the oceans. use open ocean, kelp, mangroves. Harvest the algae, turn it into biochar (charcoal). Sink it (2+ g / cc). 3
Bury biochar shallow in soils; More soil carbon stays eons, holds water.4 Plant more trees. trees need water. Evaporation leaves less in soils. Droughts hurt, forest fires soar, few trees regrow.
But restoring coastal mangrove forests works well. Paustian et al. 2016. Nature 532:49.
with fungi network & glomalin,
using no-till and compost cover.
GT CO
2
eq / year
$20/T
$50/T
$100/T
6
5
4
3
2
1
0
$20-100 / T CO
2
removed
but don’t disrupt fungi networks to do it.
It’
s a good idea,
but
from 1-3% now, to 6-10% before farming.
Grow algae in pans miles on a side, many inches deep,
Add fertilizer (Fe, N, K, P, etc.) as needed.
holding water many months.
good for 2-3 decades
orSlide74
Take More
Carbon
Out
of the Air.5 Rocks have weathered for eons, taking 1 GT CO2 / year from the air. Increase surface area a lot to speed it up: 7 GT CO2 / year: Move CO2 into crushed basalt, olivine, peridotite Scatter GT / year of olivine dust across the tropics: Add small olivine gravel to farming soils, for fertilizer & CO2 removal.6 Capture CO2 from the air with amines in artificial leaves or ceramic honeycombs, for $20-70 / ton. turn CO2 to rock in concrete or basalt. 7 Rebuild rangelands with perennial grasses.
Add soil carbon 5 x faster Deep roots, dung beetles move carbon into soil. Cut CO2 40 ppm. However, cows burp out 15% of all CH
4.
$5-63 / ton of CO2 removed.to make carbonates.
Absorb 1 T carbon / acre / yr?
with
short
rotation
cattle grazing
, like buffalo.
Fungi network holds water, so 75-90% of rain soaks in.
-40
ppm by 2100.
2% red algae feed cuts cow CH
4
98%.
Or with
polyanthraquinone
via battery charge-discharge.
Then
Or put it in salt or oil caverns underground.Slide75
Geo-Engineering
These don
’
t slow making oceans acid.Alone, we’d need to keep using them ”forever”.Use only as a temporary adjunct to massive CO2 removal.A Add Sulfates or carbonates to the Stratosphere – to block sunlight. We’d need 100 flights every day to the stratosphere by big cargo planes. The sulfates would be only 1% of what we now put in the troposphere. But they would shift rain from one region to another – drought in east Africa, etc. Still, sulfates from smokestacks now kill ~ 4 million a year. 1% of 4 million is 40,000 people a year. B Create more clouds, or whiten them more. Spray micro-particles from “guns” on ships far from land. C Mylar mirrors in Space – to block sunlight We’d need half a million square miles of mirrors now, twice the size of Texas. Add that much in 30 years, and again in 50. Even if the mirrors are as thin as Saran Wrap (drifting away as solar sails), we’d need dozens of space shuttle-sized cargo launches every day this century.
Smoke & Mirrors
$10 billion / yearSlide76
World CO2
Emissions
from Fossil Fuels
33.7 Billion Tons in 2015 US DOE / EIA . . . . . .
.
In 2012, US fossil fuel CO2 came 42% from oil, 29% from coal, 29% from natural gas.
35% came from electricity, 33% from transportation, 17% from industry.
•* Misc. = Korea, Indonesia, Thailand, Taiwan, Malaysia, Vietnam, Bangladesh, etc.Slide77
CO2 Emissions by Nation, Year
.
CO
2 Emissions from Fossil Fuels
Mid-East &Central Asia
Japan
Misc. Asia
Latin America
Africa
Canada
Oceania
=
Australia
,
NZ
, Pacif.
Misc. Asia
=
.
Korea, Indonesia, Thailand, Bangladesh, Taiwan, Philippines, Malaysia, Vietnam, etc.
In 1992,
Ukraine
etc. to
Europe
,
Kazakhstan
, etc. to
Central Asia
.
M-E & CA
= Turkey to Pakistan & Kazakhstan,
led by Iran & S Arabia
(Billion Metric Tons)
World
China
China
Russia
Europe
US
USSR
Other
Asia
Other
1-Yr %∆
2009
-0.5
2010 5.4
2011
3.8
2012
1.0
2013 -1.0
2014 -1.1
2015 -0.8
1-Yr %∆
2009
8.3
2010
7.3
2011
10.2
2012
2.9
2013
-0.8
2014
-1.5
2015
-1.6
USDoE
/ EIA
IndiaSlide78
1900-2002 World Resources Institute
1980-2015 US Department of Energy - EIA
1950-1980 Oak Ridge National Lab
...The IEA says worldCO2 output leveled offfrom 2013 to 2014 & .stayed flat in 2015-16.US DoE says it fell each year from 2012 to 2015. In 2013-14, China began CO2 cap & trade around its 7 largest cities. In 2014, China coal
use fell, for the 1st time in years: China’s CO2 output fell 4 straight years from 2012 to 2016, China’s
CO2 hit a peak in 2012. US CO2 fell 4% from 2014 to 2016, now down 15% since 2007 peak.
(1900-2015)CumulativeCO2
Emissions1.41 Trillion Tons
•
In 2015, it
fell
3
% more
.
2.9
% from 2013.
4.2% in all.Slide79
America’s Low-Carbon Revolution Has Begun
2020 is projected to be lowest
since 1983, 25% below peak.
US DOE / EIA(2020 – 9 mo rate)
US DOE / EIA(2020
– 8 mo)
US DOE / EIA
US DOE / EIA(2020 proj. from 8 mo)
Net ImportsSlide80
Companies are set to cash in on green
technologies.
For example, .GE Wind Cree & Osram (LED lighting) Solar City (rooftop PV) Archer Daniels Midland (ethanol & biodiesel)Tesla (batteries, electric cars) Johnson Controls (energy management systems)Entergy (nuclear plants) Magna International (lightweight auto parts)Wheelabrator (landfill gas) Southwestern Energy (natural gas)Halma (detect water leaks) Veolia Environnement (desalinization plants). PV = photovoltaic. LED = light emitting diode.Meanwhile, the insurance industry has begun to act.• Re-insurers – Lloyd’s of London, Swiss Re, and Munich Re – look to cut their losses by urging governments to slow climate change.• Direct insurers – like Allstate, State Farm, MetLife, Hartford – are cutting back coverage in vulnerable areas, such as Florida.• Nebraska insurance commissioners require planning for drought risk.
Large investors (> $20 Trillion in managed assets) have pushed 100+ companies to disclose their climate-related risks to shareholders. Markets now value high-carbon emitting companies lower. Carbon disclosure raises stock prices for most companies. But coal companies’ $/share fell > 2/3 since 2011. In June 2015, 6 European oil majors called for a worldwide carbon price. 9 oil majors already use shadow CO2
prices, including $60-80 / ton (2030 & ‘40) at ExxonMobil, $40 (2013) at Shell and BP, $34 at Total, and $6-45 at ConocoPhillips.
ExxonMobil was #1 target.Slide81
US CO
2
Emissions, by Use
.•trucks,airplanes,buses,trains,pipelines,ships
US CO2 Emissionsby Use
2012: USDOE - EIA(US Department of Energy -Energy Information Administration)
Concentrate on the BIG stuff: coal for electricity(with a carbon cap) & personal transportation.Slide82
Solar & Wind are now the cheapest US electricity sources.
So, their share of electric generation is rising. (next slide)
In most of the US, new solar and wind are cheaper than new gas-fired plants
and the variable operating costs of coal-fired plants too.LazardSlide83
US Electricity, by Source &
Yr
.
•••
Natural Gas, Wind & Solar replace Coal and Oil.
Solar
Hydro
Wind
Oil
Waste
Wood
Geothermal
Other Gases
Solar
•
Coal
Natural Gas
Nuclear
Renewables
Other
includes -0.15% for pumped hydro and -0.74% for misc.Slide84
The US Is Cutting
CO
2
Emissions.Pres. Obama pledged 17% 26-28% by 2025. Natural gas prices fell steeply in 2011-12 and stayed low.Cheaper gas has replaced coal - a lot - to make electricity. EPA’s interstate transport rule for SOx and NOx makescoal plants operate scrubbers more and use low-sulfur coal.This makes coal power costlier, so less coal will be used. Financial markets expect CO2 to be priced.Almost all planned coal plants have been cancelled.Over 2009-16, 14% of coal capacity retired. More is planned. New cars & trucks must average 35.5 mpg by 2016.** 1,000s of big companies save money by saving energy.
Incandescent light bulbs have mostly phased out.New standards require ever more efficient appliances.** DOE’s mpg, not EPA
’s.So, actual mpg will be less.Slide85
Solutions - Electricity
•
Price it rightCoal:• Natural Gas follows daily load up & down. trailer & flow batteries, water uphill, compressed air, flywheels, molten salt, hydrogen. Keep methane (& chemicals to groundwater) leaks from fracking to very low levels.Wind - Resource is many x total use: Growing fast, Wind turbines off the East Coast could replace all or most US coal plants. Solar - Resource dwarfs total use. Growing 40%/yr. 45¢ / day PV panel, battery, 2 LEDs, cellphone charger, radio sweeps off-grid Africa & India.Nuclear - new plants in China, India, Korea, US Southeast.Water,
Wood, Waste - Rivers will dwindle. More forest fires limit growth.Geothermal - big potential in US West, Ring of Fire, ItalyOcean
- tides, waves, currents, thermal difference (surface vs deep)Renewable energy can easily provide 80-90% of US electricity by 2050. Replacing fossil fuel & nuclear power with renewables will save scads of water, butit may require 15 x their concrete, 90 x their aluminum, and 50 x their iron, copper & glass.
To follow load, store energy in car batteries,
low at night, highest on hot afternoons & evenings.
Scrub out the CO
2
with
oxyfuel
or pre-/post-combustion process.
US Plains, coasts - NC to ME
,
Great Lakes
.
it’s usually cheaper (2-6¢/kWh) than coal.
8-9% of US GW
Output peaks near when cooling needs peak.
PV costs 2-15 ¢/kWh, thermal (with flat mirrors) 10¢.
Phase out.
retail, for everyone:
NREL,
2012
liquid sodium reactors?Slide86
Solutions
-
Efficient Buildings +At Home - Use heat pumps.Better lights - compact fluorescents (CFLs) & LEDs.Energy Star appliances Insulation - high R-value in walls & ceiling,Low flow showerheads, microwave ovens, trees, awnings, clotheslines, solar roofs Commercial - Use micro cogeneration, heat pumps.Don’t over-light.
Use LCD Energy Star computers.Use free cooling (open intakes to night air), green roofs, solar roofs.Make ice at night. Melt it during the day
Industrial - Energy $ impact the bottom line.Efficiency is generally good already.Case-specific process changes as energy prices rise.
Turn off un-used lights.
- air conditioners, refrigerators, front load clothes washers honeycomb window shades, caulking
Use
day-lighting
,
occupancy
sensors, reflectors.
Ventilate more with
Variable Speed Drives
.
Check % IRRs.
Facility
energy managers
do their jobs.
Use more
cogeneration.
- for cold water to cool buildings.Slide87
Solutions -
Personal Vehicles
US cars get 24
mpg. 7 Average 21. . Toyota started outselling Ford in the US & GM around the world. In 2014, new US cars & pickups averaged 30 mpg, vs 27 in 2007. .Hybrid sales are soaring, . In 2008, new cars averaged 37-44 mpg in Europe, 45 in Japan.To cut US vehicle CO2 by 50% in 20 years is not hard. . GM
already did it in Europe. .Lighten up, downsize, don’t over-power engines. .
Use CVTs, start-stop, VVT, hybrid-electric, diesel. .Use pickup trucks & vans only for work that requires them. .Store
wind on the road, with plug-ins & EVs.
HOW? Ditch SUVs
.
Charge them up at night.
Pickups, vans
&
SUVs
get
17
.
up to 94 mpg.
EV
s go up to 245 mi
/
charge.Slide88
Solutions - Other Transportation
Fuels -
Cut CO2 emissions further with low-carbon fuels?Save ethanol & biodiesel for boats & long-haul trucks & buses.Get ethanol from sugar cane corn ethanol’s ratio is only 0.8 or 1.3 or 1.7:1. Grain for ethanol to fill one SUV tank could feed a man for a year. Palm oil & prairie grass energy out / in = 0.7:1, up to 6:1.For biofuels, GHGs from land use changes DWARF GHG savings. Hydrogen has low energy density, is hazardous.Trains, Planes, and ShipsUse high-speed magnetic levitated
railroads (RRs) for passengers.Shift medium-haul (150 - 800 miles) passengers from airplanes to maglev RRs (faster than TGV, bullet trains).Shift long distance freight from trucks to electric RRs. Big cargo ships use 2 MW wind turbines, biofuels, nuclear reactors.
Use cellulose?
BUT
Better microbes?
Limit to ships, airplanes.
(energy out / in ratio = 8:1).Slide89
Solutions - Personal
Make
your home & office efficient.Drive an efficient car.Don’t drive much over 55 mph.Walk. (Be healthy!) Carpool.Buy things that last.Eat less feedlot beef.Garden.
Reduce, re-use, recycle.Ask Congress to price carbon.
Don’t over-size a house.
Don’t super size a vehicle.
Combine errands, idle 1 minute tops.Use bus, RR, subway.
Bicycle
.
Fix
them when they break.
1 calorie = 7-10 of grain.
Less is
healthier!
Minimize packaging.
Use cloth bags.
End CO
2
emissions before 2050.
Include tax credits
to
take CO
2
OUT
of the
air.
Move carbon from the air into the soil.
Tax carbon 2¢ /
lb
, rising 15% per year.
Compost.Slide90
Tax carbon
across fossil fuels, worldwide, in proportion to carbon content. Impose the tax upstream (wellhead, mine mouth, port). It should start low, but then rise substantially and briskly, on a pre-set trajectory.
End subsidies for production and use of fossil fuels.
Give carbon tax credits for carbon removal from ambient air, at the same rate carbon emissions are taxed.
Policy
US$40 / tonne of carbon ($10 / ton CO2), rising 15% / year.
Return net proceeds as equal tax credits to individuals.
This creates jobs and grows GDP, compared to no carbon tax. Slide91
QUESTIONS?
Contact
Dr. Gene Fry for more details, citations & references.gene.fry@rcn.comwww.globalwarming-sowhat.comWe humans must go carbon negativebig time,by 2050.Slide92
Mini-References
•
-15M years CO2, ºF, sea level: Tripati ’09; 3-5 Mya: Csank ’11, Dwyer ’08. Jet stream’s big meanders now – Petoukhov ’13. • CO2 levels: 1958-2005 - Keeling et al., ’05; 1740-1960 - IPCC. Warming H2O un-dissolves CO2: HS chem text. • GHGs & % effect: IPCC; www.nature.com/climate/2008/0812/full/climate.2008.129.html. Sulfur 30-45%: IPCCSolar output: www.pmodwrc.ch/pmod.php?topic=tsi/composite/SolarConstant
. Cloud feedback: Clement ’09.450 million MW heat gain = area of Earth x 0.87 W/m2 – von Schuckmann ’20. 0.6ºC “in the pipeline” - Hansen ’05Temperature rise: NASA GISS: http://data.giss.nasa.gov/gistemp/. UCS study: www.climatechoices.org/ne/Ocean heat:
Domingues ’08 (+1.8x10²³J, 0-700m, ’70-’06); Lyman ’10 (+1.5); Levitus ’08 (+1.6). 1020J/yr US, 2x10²².
Ocean acid: Wikipedia. Corals: oceana.org. Himalayas: Powell, Science News 0812. polar icecaps: Rignot ’06 etc., NOAA ’12
Arctic Ocean ice volume: Wipneus ’12, area www.ijis.iarc.uaf.edu/. Albedo Hudson ’11. Antarctic, Greenland ice Shepherd ’12
Sea level
rise:
Summerhayes
’
09, NRC
’
10, NOAA
’
12
.
P
ermafrost
: 4-5 x human:
Zimov
’
06; shrank
7%: IPCC
’
07; rate ~ cars: Dorrepaal
’09; to 2100, Schuur ’12; & to 2300 MacDougall ’12; CH4 hydrates: wikipedia, Shakhova ’10.
Antarctic: now
Wadham
’
12
, PETM
DeConto
’
12; Ocean CO
2
-7 & 50%
:
Behrenfeld
’
06
, Schuster
’
07, Lee
’
09,
Watson
’
07
Subtropical arid belts moved ~140 miles: Seidel
’
07;
Reichler
’
06. Severe drought cut CO
2
uptake: Jacobson
’
07.
Forest fires up 6 x since 1986: US -
Westerling
’
06 Siberia -
Soj
a
’07, Canada - Stock ’06. Up 2-7 x / +1ºC: NRC ’11.Monsoon rain -10-20% Koll ‘15; Falling water tables, vanishing lakes, rivers Brown ’06. China deserts +50%
Globe & Mail
3/08
Ocean pH - Turley
’
05. Land & sea carbon sinks fade - Jacobson, Potter,
Wiedinmyer
,
Canadel
, Le
Quere
- all
’0733% > H2O in air at = relative humidity - Rind ’90. 10% > rain offsets +1ºC - M. Parry ’05 & Lester Brown.Tree biomass falls 40%: Overpeck & Bartlein, ’89 (in Rind ’90). Simulation: species not allowed to migrate north.Net biological productivity falls 30-70%: Rind et al.
’90. Browning of Earth began in 1994: Fung, ’05.Crop yields could fall 30-50% - Peart et al., Ritchie et al., Rosenzweig et al., all ’89 (in Rind et al., ’90) CO2 fertilization, greenhouses: Wittwer ’92, Idso
’01; open fields: Idso ’02, Kimball ’02. Groundwater USGS ’13.Crop yields fall 10%/ºC rise: Peng ’03; 17%/ºC (618 US counties) Lobell ’03; Asia rice: Welch ’10; wheat, corn: Lobell ’11Overview of crop yields fall per º
C rise: Hatfield ’11. Photosynthesis 35º slow, 40º stop: Wali ’99.Grain: production - FAO, Worldwatch Institute; use - Climate Change Futures: Swiss Re & Harvard School of Public HealthFood price rises: FAO www.fao.org/giews/english/cpfs/index.htm, Brown (EPI) ’08, Chicago Board of Trade
Damages, 2º-4ºC: Stern Review ’06. $1.6 T/yr - DARA ’12; $100 T (PV - Watkiss ’
06; $20 & $85/T CO2 - Stern Review ’06Extinctions May ’10. Mirrors & sulfates block sun: Wikipedia. Iron in ocean, e.g., Planktos Inc. (www.planktos.com)
Carbon reduction costs - Stern Review ’06. Green Companies - Smith Barney/Citigroup ’07, 08; CERES ’05, ’06Coal oxyfuel process, 100 years of emissions storable underground - Metz et al. (IPCC) ’05; Herzog, MIT, ’0613% coal retirements: Thinkprogress.org. US wind MW & kWh % - USDOE-EIA. Wind & solar growth %/yr: USDOEAverage mpg’s - USDOE EIA (
Monthly Energy Review, Table 1.9). Hydrogen cars - Spessard
’06.Ethanol: energy out: Pimentel ’05, Shapouri ’04; SUV / food: Brown ’07; Land use: Searchinger, Fargione ’08.Taking Carbon Out of the Air 1)
grazing: www.holisticmanagement.org/; 2) farming: Comis ’01, Smith ’11, Rodale ’05, Mitchell ‘15; 3) rocks: Lackner ’02, Schuilling
‘14; 4) trees & soils www.onearth.org Spring ’08; 5) www.carbonsciences.com.