
as vaccine carriers Livia Nasz á lyi Nagy Department of Organic and Macromolecular chemistry NMR and Stuctural analysis research group vaccines Targeted delivery may be achieved Simultaneous delivery of antigen and adjuvant ID: 781464
Download The PPT/PDF document "Ceramic core@shell nanospheres" is the property of its rightful owner. Permission is granted to download and print the materials on this web site for personal, non-commercial use only, and to display it on your personal computer provided you do not modify the materials and that you retain all copyright notices contained in the materials. By downloading content from our website, you accept the terms of this agreement.


Slide1
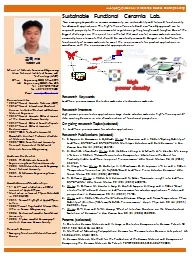
Ceramic core@shell nanospheres as vaccine carriers
Livia Naszályi Nagy
Department of Organic and Macromolecular chemistry
NMR and
Stuctural
analysis research group
Slide2vaccines
Targeted delivery may be achieved
Simultaneous delivery of antigen and adjuvant
NP elicits boosted immune response due to it’s size
2
Nanovaccines
2011-2020
Decade
of vaccines (WHO)
Demand
for new vaccines
Slide3Immune stimulator:
CpG
ODN 1826 (
phosphorothioate
backbone)
s
ilica
@z
irconia
vaccine carriers
have to bind immune stimulator (adjuvant)
for certain biological experiment have to be fluorescent
be colloidally stable and do not release cargo at pH 7.4
3
Nanoparticulate carriers with
same
surface chemistry – different size
5’-tccatga
cg
ttcctga
cg
tt-3’
silica
zirconia
immune
stimulator
NMR
In NMR4Nanos MIF project
Slide4Z. Hens et J.C. Martins, Chem. Mater., 2013, 25 (8), pp 1211–1221
NMr Toolbox
Line broadening in 1D
1
H NMR
2D
1H-1H DOSY: Decrease in the diffusion coefficient
2D
1
H-
1
H NOESY: difference in crosspeaks sign and intensity
4
Slide5Material preparation5
Formation of ZrO
2
shell
on
SiO
2
NPs
dropwise addition of
tetrabutyl
zirconate
50°C, 3 h,
Ar
atmosphere
Surface modification of SiO
2
@ZrO
2
NPs
Deoxynucleoside
monophosphate mixture
(
dAMP
,
dCMP, dGMP and TMP) 2 mg/ml in waterCpG ODN 1826 oligonucleotide 2.5 mg/ml in water5(6) carboxyfluorescein 2.0 mg/ml in ethanolDialysis
W. Stöber et al., J. Colloid Interface Sci. 26, 62-69 (1968).
hydrolysisunder basic conditionsSN2condensation:
-H2O
SiSiSi
SiSiSihydrolysisunder slightlybasic conditionscondensation
-H2OOH
SiSiZr
ZrZrSynthesis of Stöber
silica nanoparticles Controlled hydrolysis and condensation of tetraethyl orthosilicateethanol solvent, RT, 24h;evaporation of ammoniaJ. M. Kim et al., Ceram. Int. 35, 1243–47 (2009).
Slide6Investigation of adsorption6
FTIR spectroscopy
1D 1H NMR and
2D
1H-1
H NMR NOESY
and DOSYSimultaneous measurement of zeta potential of NPs and
UV absorbance
of supernatant
vs.
pH
Set suspension pH
Measure zeta potential
Transfer sample to Epp
Settle out particles
Dilute supernatant for UV-vis
1 mg/ml
Slide77
Sample
SiO
2
volume mean diameter
(nm)
SiO
2
@ZrO
2
volume mean diameter
(nm)
SiO
2
@ZrO
2
PdI
S2Z
123
34
109
29
0.021S3Z75
25134 530.133
S4Z35 1347
130.043S6Z
6 325 60.021SiO2@ZrO2 nPs
Slide8Results of surface modification8
Slide9Adsorption of Nucleoside MPs
Nu mixture: whitening + stabilizing effect
FTIR: base-pair formation,
Phosphate-group binding
Zeta potential of dialyzed samples
S2Z
d
A
MP
-
0.2
±
0.0
mV
d
C
MP
-
6.3
±
0.6 mV
dGMP
-53.0 ±
1.0 mV
TMP-
30.3 ± 0.5 mVNu-22.2 ± 0.3 mVnative11.9 ± 0.2when added to ethanolic sol
9
Slide10Adsorption of Nu
10
2D
1
H-
1
H DOSY NMR on S6ZNu
2D
1
H-
1
H
NOESY NMR on
S6ZNu
Surface desorption experiment in NMR
pH 6.5
pH 6.9
+ Nu
+ Nu
+ Nu
pH 7.7
Surface coverage
for S2ZNu
0.62 mg Nu/ NP m
2
when added to ethanolic sol
Slide11Adsorption of Nucleoside MP
s and ODN
Adsorption occurs below pH 7
Investigation of concurrent adsorption
of
immune
stimulator and fluorophore
Nu and ODN bind stronger than CF
ODN stays at the NP surface at pH 7.4, CF and Nu are likely to desorb
use of dye labelled ODN
11
when added to aqueous sol
0.66 mg/m
2
for ODN
0.66-0.88 mg/m
2
for Nu
0.30 mg/m
2
for ODN
0.15 mg/m
2
for CF
0.66 mg/m2 for Nu0.33 mg/m2 for CF
Slide12CF pushed off the surface by ODN in NMR investigation
12
Adsorption of CF
and
ODN
when added to aqueous sol
Detail of
1D
1
H NMR
spectra
ODN
S4Zd + ODN
S6Z CF
S6Z CF
+ ODN, washed, +ODN
Slide1313Effect of Buffer on adsorption
Buffer
Adsorption of Nu
Remark
K-phosphate
Confined
Charged surface
HEPES*
No interference
Complexation
MES**
No interference
pH 6.0- 6.7
*4-(2-hydroxyethyl)-1-piperazineethanesulfonic acid, **2-(N-
morpholino
)
ethanesulfonic
acid
*
**
Evaluation of MES analogues of
higher
working
pH (MOPSO)
when added to aqueous sol
Slide1414
B
road signals
in 1D
1
H NMRThe sharp lines give negative NOEs at 500 ms mixing time
when added to aqueous sol
Adsorption of Nucleoside MP
s and ODN
S6Zd + Nu in
basic water
0.1 mg Nu / m
2
NP
S4Zd + ODN in basic water
0.6 mg ODN / m
2
NP
H
2
O
S6Zd + Nu in
basic water
H
2
O
Slide15Summary15
in water
Pure adsorption of ligands
Lower amount of Nu adsorbed
in ethanol
Ligands precipitate onto the NP surface: very little “real” adsorption
Higher cargo
Surface modification of SiO
2
@ZrO
2
NPs
Addition of ligands in DMSO
Use FITC-
labeled
ODN
Find
non-
interfering
buffer
Slide16Acknowledgement
Synthetic and analytical laboratory facilities to Prof. Isabel Van Driessche (SCRIPTS group), Prof. Peter Dubruel (PCN group),
Prof. Stefaan de Smedt (GeRN group)
Promotor: José C. Martins
Mentor: Krisztina Fehér
This project has received funding from the European Union’s Horizon 2020 research and innovation
programme
under the Marie
Sklodowska
-Curie grant agreement No 703374.
TEM
analysis
to Katrien De
Keukeleere
and Evert
Dhaene
Slide17Livia Naszályi NagyMarie Curie postdoctoral researcherdepartment of Organic and Macromolecular Chemistry
E Livia.NaszalyiNagy@ugent.be
T +32 9 264 44 88
M +32 487 126 129
www.ugent.be
Ghent
University@ugentGhent University
Thank you for your attention!
Slide18Nu mixture 1H NMR
18
2D
1
H-
1
H DOSY
Slide19Fluorophore adsorption to NP19
Slide2020
Slide21SiO2@ZrO2 – HEPES interaction
Appearance
of new UV absorbance peak at 238 nm
related to
particle – HEPES interaction
21
Slide22A.F. Martins et al. Contrast Media Mol. Imaging 2013 (8) 265
22
S
i
O
2
@ZrO2 – HEPES interaction
S6Z Nu + 10 mM HEPES
S6Z Nu + 10 mM HEPES
HEPES
HEPES
HEPES
Ga
3+
+ HEPES
Slide23Base pair formation in Nu mixture:adsorption to the surface through phosphate group, charged surface
23
Adsorption of
d
GMP
when added in aqueous solution to ethanolic sol
Ethanol
Butanol
Strong interaction between dGMP/TMP and
SiO
2
@ZrO
2
surface? Titration: yes
NMR: no sign of adsorption
FTIR:
transformation of silica network
formation of Si-phosphate bonds
gel formation: dGMP stacking*
*Neurohr and Mantsch, Can. J. Chem. 1979 (57) 1986
Slide24Adsorption of dGMP to S2Z24
Spontaneous stacking of dGMP in aqueous solution
Slide25Adsorption of dGMP to S2Z25
Slide26Effect of HEPES on ODN adsorption26