
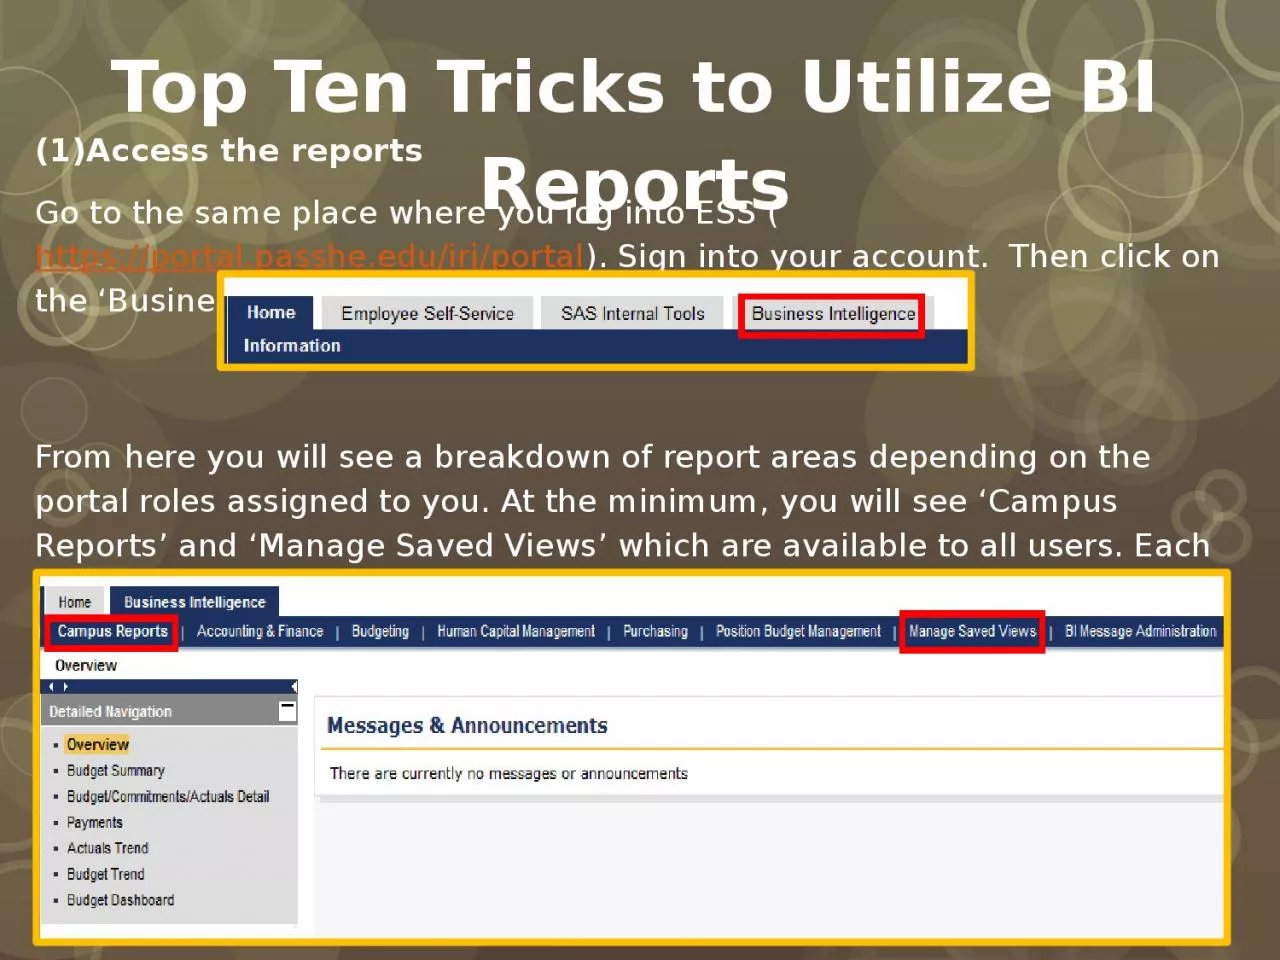
Access the reports Go to the same place where you log into ESS httpsportalpassheeduirjportal Sign into your account Then click on the Business Intelligence tab From here you will see a breakdown of report areas depending on the portal roles assigned to you At the minimum ID: 1029188
Download Presentation The PPT/PDF document "Top Ten Tricks to Utilize BI Reports" is the property of its rightful owner. Permission is granted to download and print the materials on this web site for personal, non-commercial use only, and to display it on your personal computer provided you do not modify the materials and that you retain all copyright notices contained in the materials. By downloading content from our website, you accept the terms of this agreement.


1. Top Ten Tricks to Utilize BI ReportsAccess the reportsGo to the same place where you log into ESS (https://portal.passhe.edu/irj/portal). Sign into your account. Then click on the ‘Business Intelligence’ tab. From here you will see a breakdown of report areas depending on the portal roles assigned to you. At the minimum, you will see ‘Campus Reports’ and ‘Manage Saved Views’ which are available to all users. Each area then contains individual reports. When you click on a report link, it will open in a new window.
2. After clicking on the report link (such as Budget Summary), a variable screen will appear. Depending on how you’ve been personalized (funds centers or part of the BCS Group hierarchy assigned to you), you may only have to click ‘OK’ to execute the report. If you wish to add funds centers or change the fiscal year, you can do so here by entering them in the Current Selection box: Please remember to change the Fiscal Year if needed.
3. (2) Export the data (Excel or PDF) Be sure to get the data exactly how you want to export it before accessing the buttons. Because the formulas for results rows don’t translate to Excel (just the values), it’s best to remove them prior to exporting if you’re going to do further manipulation in Excel. Both options are available side by side on the toolbar:
4. If you choose Excel: You’ll be asked if you want to open the file -> Click Open then you’ll be notified that the file is in a different format -> Click Yes. Because your file exports in a single web page format, it’s best to save your file immediately as an excel workbook (,xlsx)so if you make some changes or plan to send it to another user, it will be in the correct format. If you choose PDF: The data will be automatically formatted in a nice format for printing. You do have the ability to change some of the properties when you initially click on the button but it is not required -> Click OK. Then click ‘Open’ or save the pdf to a place of your choosing. (3) Activate or deactivate a hierarchy (grouping of data) When you execute the Budget Summary on the Campus Reports tab, the default view shows Fund (without the hierarchy activated), Funds Center (without the hierarchy activated), and Commitment Item (with the hierarchy activated). You have the ability to turn hierarchies on and off by using the fast filters (for the common characteristics), right-clicking on the characteristic itself using the context menu, or by right-clicking on the characteristic and accessing the Properties of the Characteristic. Below all three are illustrated. A hierarchy is nothing more than grouping the data into assigned categories. In this case, the commitment items associated with 7011490100 are grouped as they are in the commitment item hierarchy so you have the advantage of seeing totals for Expenses, Personnel, Salaries & Wages, etc. versus totals only for those individual commitment items.
5. Before:
6. Example 1:To deactivate the Commitment Item Hierarchy using the fast filters select Commitment Item -> Hierarchy -> Deactivate.
7. Result:
8. Example 2: To activate the Commitment Item Hierarchy using the context menu, right-click on Commitment Item -> Select Hierarchy -> Select Hierarchy Active.
9. Result:
10. Note: This takes you back to where you started in the default view. However, the hierarchy is rolled up. The context menu gives you the ability to expand the hierarchy to a specific level once it’s been activated (directly below the ‘Hierarchy Active’ option).
11. Result:
12. Example 3: To deactivate the Commitment Item Hierarchy using the Properties of the Characteristic, right-click on the characteristic to once again access the context menu -> Select Properties -> Characteristic -> Hierarchy tab -> Uncheck the ‘Hierarchy Active’ box -> OK.
13. Result:
14. (3) Add or remove results rows To add a results row to a characteristic you can utilize the fast filter or the context menu. You can further decide to display all results or show results only when more than one value appears. Example 1: Add a results row to Funds Center using the fast filter.
15. Example 2: Add a results row to Funds Center using the context menu.
16. Result for both:The easiest way to remove a results row is to click on the results row itself and drag it off the report until you receive a small X. Then release.
17. Result:(4) Sort a column of data You can quickly sort a column in ascending or descending order using the nodes directly to the right of a key figure (numerical data). Example: Sorting Commitments & Actuals from highest to lowest using the key figure Click on the node directly to the right of the key figure you want to sort by.
18. Then click again to sort the data in either ascending or descending order (sorts in ascending first so click again if you want descending): (5) Sort a row of data You can sort a row (by key or text) by using the fast filters or the context menu. Example 1: Sorting Commitment Item in descending order by the key using the fast filter
19. (6) Sort a row of data You can sort a row (by key or text) by using the fast filters or the context menu. Example 1: Sorting Commitment Item in descending order by the key using the fast filter
20. Result:
21. Example 2: Sorting Commitment Item in ascending order by the text using the context menu
22. Result:
23. Change the display of a characteristic You have the ability to see the key, text, or any combination of the two (in any order) for any given characteristic in the report. You can change the display by utilizing the fast filters or the context menu. Example 1: Change Commitment Item to Key only by using the fast filters
24. Example 2: Change Commitment Item to Key only by using the context menu
25. Result for both:(7) Save a user view and access it later Get the view exactly how you want it in terms of format. Then click the SAVE button on the toolbar.
26. Give the view a detailed description so you’ll know what it is to access it later then click OK. You may need to scroll down to see where you enter in the “Description”
27. The view will immediately appear in your Open folder as well as on your ‘Manage Saved Views’ tab on the portal so the next time you want to access this view you can either A) Execute the report and click the Open icon to retrieve the view or B) Go to the ‘Manage Saved Views’ folder and select the view from there without having to even run the report. Managed Saved Views is located where you first open up BI. Option A: Select the view and then click OK.
28. Option B: Go to the portal and select the view from ‘Manage Saved Views’ and the report will execute (but inside of the portal):
29. Result:
30. (8) Change the variables after executionIf you execute a report one way, do some manipulation, then decide you want to change a variable or two (Ex. Fiscal Year), you can select the variable button to call the initial screen back again and change any of the values. The biggest advantage of utilizing the button versus rerunning the report is that your formatting changes remain unchanged and the data repopulates according to the changed variables.Example: Ran the report for Fiscal Year 2015 and wanted to change to 2014 after making a few navigation changes.
31.
32. Result (same navigation state and different Fiscal Year only):
33. (9) Navigate (drag & drop to move columns/rows, add, eliminate, etc)Click on the Navigation Pane button to access a full list of characteristics available in the report.The layout is broken down into columns, rows, and free characteristics so you can see exactly what is being utilized and what can be added.
34.
35. To manipulate the fields, you can do so within the navigation pane itself or between the pane and the report (whichever is more comfortable for you). Example 1: Remove Commitment Item from the rowsClick and drag Commitment Item out of the navigation pane then release. When removing a characteristic, you will receive an ‘X’.
36. Or you can remove the characteristic from the report itself:Note: Be sure to select the heading versus an individual component. Depending on what you’re selecting, you may only remove a segment versus the entire characteristic. For example, removing Commitment Item from the row requires selecting the heading whereas removing 510580 specifically requires removing that individual item.
37. Result:
38. Example 2: Swap Funds Center with Functional Area (Transactional)Click and drag Functional Area (Transactional) “overtop” of Funds Center until you receive a teal color. Then release the mouse.
39. Or click and drag Functional Area (Transactional) over Funds Center in the report until you receive a teal color and release.
40. Result:
41. Example 3: Add Fiscal Period to the rows following Functional Area (Transactional)Click on Fiscal Period and drag it below Functional Area (Transactional) until you receive a black line marking where the field will be inserted. Then release.
42. Or drag the characteristic into the report itself:
43. Result:
44. For additional help on navigation, please access the Navigation Manual. It’s available on every BI Report (the last icon on the toolbar). If you have additional questions, please contact Linda Moore at ext. 2234 or email @ linda.moore@sru.edu.