
Vegetation Lidar MOLITadashi Imaia Rei Mitsuhashia Daisuke SakaizawaaToshiyoshi KimuraaKazuhiro Asaiba Japan Aerospace Exploration Agency JAXAb Tohoku Institute of Technology19BackgroundTerrestrialca ID: 874845
Download Pdf The PPT/PDF document "The Status of" is the property of its rightful owner. Permission is granted to download and print the materials on this web site for personal, non-commercial use only, and to display it on your personal computer provided you do not modify the materials and that you retain all copyright notices contained in the materials. By downloading content from our website, you accept the terms of this agreement.


1 The Status of Vegetation Lidar MOLI Ta
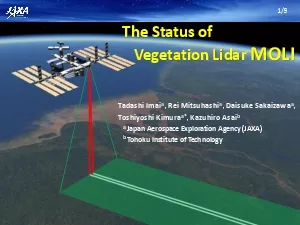
The Status of Vegetation Lidar MOLI Tadashi Imai a , Rei Mitsuhashi a , Daisuke Sakaizawa a , Toshiyoshi Kimura a* , Kazuhiro Asai b a Japan Aerospace Exploration Agency (JAXA) b Tohoku Institute of Technology 1 /9 Background ⢠Terrestrial carbon budget due to land use change and carbon absorption by forests are more uncertain than others . ï¼ Ciais et al . , 2013 ï¼ The uncertainty is mainly caused by difficulty of measuring for
2 ests globally . ⢠Lidar can observe pr
ests globally . ⢠Lidar can observe precise canopy height and biomass and we could estimate global forest biomass using data fusion of lidar, Imager and SAR data . ⢠High - precision forest biomass data will reduce the uncertainty of forest sinks and contribute to a better understanding of the carbon cycle . Ciais et al., 2013 Atmospheric increase 4.0 ± 0.2GtC/year Atmosphere - to - Ocean flux 2.3 ± 0.7GtC /y Residual land sink 2.6
3 ± 1.2GtC/y Anthropogenic Emissions 8.9G
± 1.2GtC/y Anthropogenic Emissions 8.9GtC/y Fossil fuel & cement 7.8 ± 0.6GtC/y Land Ocean Net land use changed 1.1 ± 0.8GtC/y (2000 - 2009) 2 /9 Outline of MOLI ⢠MOLI ( M ulti - footprint O bservation L idar and I mager) ⢠Installed on ISS JEM - EF ⢠Orbit ï¼ ISS orbit â Non - sun - synchronous â Inclination : 51.6 deg â Altitude : about 400 km ⢠Sensors ⢠LIDAR (1μm, multi footprint) ⢠Imager(Green, Red, NIR )
4 â GSD:5m, swath : 1km ⢠Launcher â
â GSD:5m, swath : 1km ⢠Launcher ⢠Target launch : JFY 2024 MOLI MOLI 3 /9 Direction of ISS ï¼ Features of MOLI ï¼ 2 line Lidar observation 3 - band Imager observes 1km swath including lidar footprint area. MOLI Observation Image 2line 1km GSD: 5m Green, Red, NIR 4 /9 2line MOLI Observation Image Direction of ISS ï¼ Features of MOLI ï¼ 2 line Lidar observation 3 - band Imager observes 1km swath including lidar footprint area.
5 1km GSD: 5m Green, Red, NIR 5 /9 2line
1km GSD: 5m Green, Red, NIR 5 /9 2line Direction of ISS 1km GSD: 5m Green, Red, NIR MOLI Observation Image We can estimate slope angle from altitude information of three footprints We can correct for canopy height errors and elevation errors due to slope using the slope angle information. 6 /9 Features of MOLI MOLI Imager: Spatial Resolution: 5m Swath: 1km Band Green: 520 - 600 nm Red: 610 - 690 nm NIR: 760 - 890 nm 1km 1km Imager da
6 ta Canopy height map MOLI Lidar data (C
ta Canopy height map MOLI Lidar data (Canopy height) Other imagers: (e.g., Landsat - 8) Spatial Resolution: 30m Swath: 185km Band BLUE: 450 - 515 nm Green: 525 - 600 nm Red: 630 - 680 nm 185km 185km 40m resolution about 100m resolution MOLI L3 product MOLI L4 product Data fusion Data fusion + Data fusion 7 /9 Trial product Product level Product category Products Remark L1B (Standard) Lidar footprint products Waveforms( ⧠500Msps)
7 including geolocation data Footprint Pos
including geolocation data Footprint Position Accuracy ⦠15m Imager product (1km swath) Image ï¼ Red, Green, NIR ï¼ geometrically corrected L2 (Standard) Lidar footprint products Canopy heights ± 3m(Canopy Height is under 15m) ± 20% (Canopy Height is over 15m) Forest biomass ± 25t/ha (Biomass density is under 100t/ha) ± 25% (Biomass density is over 100t/ha) L3 (Research) Integrated products with Lidar and imager (1km swath) C a
8 nopy heights Target â C anopy heights
nopy heights Target â C anopy heights ± ~5m(Canopy Height is under 15m) ± ~40% (Canopy Height is over 15m) â Forest biomass ± ~40t/ha (Biomass density is under 100t/ha) ± ~40% (Biomass density is over 100t/ha) Forest biomass L4 (Research) Wall - to - Wall map products ( Integrated with GCOM - C/SGLI, SAR Data ) Canopy height map Forest biomass map MOLI product â» Multi - footprint is expected to compensates each product up to 3
9 0 degrees of slope. 8 /9 1. JAXA has co
0 degrees of slope. 8 /9 1. JAXA has conducted MOLI study and MOLI will be installed to ISS . 2. MOLI will be able to provide high precision canopy height and forest biomass data, globally . 3. We will also provide canopy height map and forest biomass map created by lidar data and imager data (e . g . , SGLI, ALOS - 2 , 4 , ALOS - 3 ) fusion . 4. Target launch is now JFY 2024 and we are struggling to get national budget . Status & Summary