
Approaches of BCG Matrix Components of BCG Matrix Applications of BCG Matrix Advantages of BCG Matrix Limitations of BCG Matrix The BCG Matrix High Low Relative position Market Share ID: 912363
Download Presentation The PPT/PDF document "BCG Matrix Contents Emergence of BCG M..." is the property of its rightful owner. Permission is granted to download and print the materials on this web site for personal, non-commercial use only, and to display it on your personal computer provided you do not modify the materials and that you retain all copyright notices contained in the materials. By downloading content from our website, you accept the terms of this agreement.


Slide1
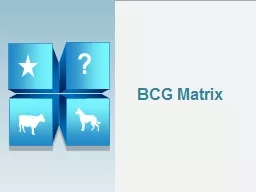
BCG Matrix
Slide2Contents
Emergence of BCG Matrix
Approaches of BCG Matrix
Components of BCG Matrix
Applications of BCG Matrix
Advantages of BCG Matrix
Limitations of BCG Matrix
?
Slide3The BCG Matrix . . .
High
Low
Relative position (Market Share)
Low
High
Business growth rate
The Boston Consulting Group (BCG), founded in
1963, was a pioneering consulting. It introduced various concepts like ”experience curve” and ”growth-share matrix”
The experience curve says that the cost would come down to certain extent cumulative production is doubled. May establishments got an idea to minimize their cost and expand their capacity aggressively.
However, when inevitable market downturns occured or innovative products were introduced, the flaws of this approach became apparent
Companies found themselves with excess capacity and outdated product designs, as well
as reduced capacity for innovations given their previous focus on cost-cutting
Slide4Components of BCG Matrix
Each of the four quadrants of the grid has different implication for the SBUs that fall into the category
Stars are SBUs that compete where there is high market share and high-growth industries.
Question marks are SBUs
which have weak market shares but they compete in high-growth industries.
Cash cows are SBUs which operate in high market shares but in low-growth industries.
Dogs are SBUs
which operate in low-growth industries with weak market shares.
Stars
?
Question marks
Cash cows
Dogs
Slide5BCG Matrix application
High
Low
Relative position (Market Share)
Low
High
Business growth rate
Invest if needed to create cash cow
Select a few
Divest the others
Liquidate
Slide6This is a DEMO Course On –
BCG Matrix.
Join MSG Premium Membership
and Get Access to around 120 Courses + New courses added every week.
What You Get:
View All Courses Online.
Download
Powerpoint Presentation for Each Course.
Do the Knowledge Checks for Each Course.
ManagementStudyGuide.com