
Kinematics Terminology Scalar vs Vector Scalar quantities that have only a size but no direction i e distance speed Vector quantities that have a size and direction ie displacement velocity ID: 486860
Download Presentation The PPT/PDF document "1.1 Motion and Motion Graphs" is the property of its rightful owner. Permission is granted to download and print the materials on this web site for personal, non-commercial use only, and to display it on your personal computer provided you do not modify the materials and that you retain all copyright notices contained in the materials. By downloading content from our website, you accept the terms of this agreement.


Slide1
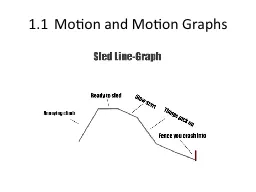
1.1 Motion and Motion GraphsSlide2
Kinematics Terminology
Scalar vs. Vector
Scalar:
quantities that have only a size, but no direction
i
e
:
distance, speed
Vector:
quantities that have a size and direction
ie
:
displacement, velocitySlide3
Kinematics Terminology
Distance (
d
)
– the length of the path travelled Position ( d ) – describes the distance and direction from a reference pointDisplacement ( Δd ) – the change in position of an objectSlide4
Speed and Velocity
Average Speed
– the total change in distance over an elapsed period of time
(m/s)
Average Velocity
– the change in displacement over an elapsed period of timeSlide5
Speed and Velocity
Instantaneous Velocity
– the velocity of an object at a specific timeSlide6
Example
A jogger takes 25.1 s to run a total distance of 165 m by running
140
m [E] and then 25 m [W]. The displacement is 115 m [E]
.
(a) Calculate the jogger’s average velocity. (b) Calculate the jogger’s average speed.Slide7
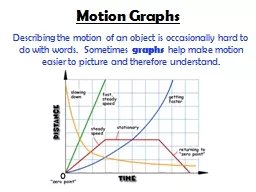
Position-Time Graphs
A straight line represents uniform motion
Positive slope
forward motion
Negative slope backward motionZero slope stationarySlide8
A curved line represents non-uniform motion (acceleration)
v
avg
slope between two pointsvist slope of tangent
Position-Time GraphsSlide9
Example
The position–time graph
shows
the details of how an
object moved.
Calculate the average velocity during thetime interval t=1.0 s to t=2.5 s.Slide10
Acceleration
Uniform Motion
– motion at a constant speed in a straight line
Non-uniform Motion
– the change in an object’s velocity
Acceleration – the change in velocity over an elapsed time periodSlide11
Velocity-Time Graphs
A straight line represents constant acceleration
Positive slope
acceleration
Negative slope deceleration
Zero slope constant velocity (no acceleration)Slide12
Velocity-Time Graphs
A curved line represents non-uniform acceleration
a
ave
slope between 2 pointsainst slope of tangentSlide13
Homework
Read
Section 1.1
Questions
p. 10 #1-3
p. 15 #1-3 p. 16 #1-2, 4-6