
Institutional Research Colorado State University Student Engagement for Diverse SubPopulations at CSU 2012 NSSE Results Student Affairs Assessment Symposium March 29 2013 National Survey of Student Engagement NSSE ID: 700422
Download Presentation The PPT/PDF document "Heather Novak, Ph.D. Statistical Researc..." is the property of its rightful owner. Permission is granted to download and print the materials on this web site for personal, non-commercial use only, and to display it on your personal computer provided you do not modify the materials and that you retain all copyright notices contained in the materials. By downloading content from our website, you accept the terms of this agreement.


Slide1
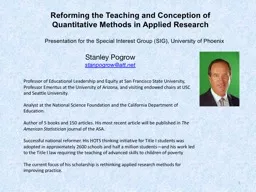
Heather Novak, Ph.D.Statistical Research Analyst Institutional ResearchColorado State University
Student
Engagement for Diverse Sub-Populations at
CSU:
2012
NSSE
Results
Student Affairs Assessment Symposium
March 29, 2013Slide2
National Survey of Student Engagement (NSSE)
What is NSSE
Survey administration
The theory of student engagementNSSE ‘Benchmarks of Effective Educational Practices’How NSSE data can be usedVariability within CSU’s NSSE dataLongitudinal change at CSUPeer comparisons
2013 Assessment Symposium
2Slide3
3
2013 Assessment SymposiumSlide4
2013 Assessment Symposium
4Slide5
2013 Assessment Symposium5
CSU Population ParameterSlide6
Variation within CSU’s NSSE Scores
We will focus on variation within CSU’s NSSE data by looking at benchmark scores across first-generation, minority, and low-income statuses.
2013 Assessment Symposium
6Slide7
Level of Academic Challenge (LAC) Challenging intellectual and creative work is central to student learning and collegiate quality. Colleges and universities promote high levels of student achievement by emphasizing the importance of academic effort and setting high expectations for student performance.
2013 Assessment Symposium
7Slide8
Active and Collaborative Learning (ACL)
Students learn more when they are intensely involved in their education and asked to think about what they are learning in different settings. Collaborating with others in solving problems or mastering difficult material prepares students for the messy, unscripted problems they will encounter daily during and after college.
2013 Assessment Symposium
8Slide9
Student-Faculty Interaction (SFI)Students learn firsthand how experts think about and solve practical problems by interacting with faculty members inside and outside the classroom. As a result, their teachers become role models, mentors, and guides for continuous, life-long learning
.
2013 Assessment Symposium
9Slide10
Enriching Educational Experiences (EEE)Complementary learning opportunities enhance academic programs. Diversity experiences teach students valuable things about themselves and others. Technology facilitates collaboration between peers and instructors. Internships, community service, and senior capstone courses provide opportunities to integrate and apply knowledge.
2013 Assessment Symposium
10Slide11
Supportive Campus Environment (SCE)Students perform better and are more satisfied at colleges that are committed to their success and cultivate positive working and social relations among different groups on campus.
2013 Assessment Symposium
11Slide12
Variation within CSU’s NSSE Scores
In summary, there is not much variation in the benchmark averages across first-generation, Pell-recipient, or minority status.
2013 Assessment Symposium
12Slide13
CSU’s NSSE Scores over Time
CSU has participated in the NSSE survey eight
times. The
benefit of having multiple NSSE administrations is that longitudinal trends in NSSE responses at CSU can be explored. 2013 Assessment Symposium13Slide14
Summary of CSU’s NSSE Scores over Time
14
2012 Change from 2007
First-Year
Senior
Level of Academic Challenge
(LAC)
+
+
Active and Collaborative
Learning (ACL)
+
+
Student
Faculty Interaction (SFI)
+
=
Enriching
Educational Experiences (EEE)
+
=
Supportive Campus Environment (SCE)
+
+
2013 Assessment SymposiumSlide15
2013 Assessment Symposium15Slide16
CSU’s NSSE Scores compared to PeersA benefit of participating in NSSE is that CSU can compare our scores to the average score from a group of selected peer institutions.
2012 NSSE Results
Diversity Symposium
16Slide17
Peer Comparisons2013 Assessment Symposium
17
2012 CSU compared to the average 2012
NSSE score for other large public research institutions
First-Year
Senior
Level of Academic Challenge
(LAC)
-
=
Active and Collaborative
Learning (ACL)
=
+
Student
Faculty Interaction (SFI)
=
=
Enriching
Educational Experiences (EEE)
-
-
Supportive Campus Environment (SCE)
+
=Slide18
Conclusions
There is not worrisome variation in engagement scores across socio-economic diversity variables
CSU has considerable improvement in our 2012 NSSE scores compared to 2007
In terms of the peer comparisons CSU has room for improvement, especially for the EEE benchmark2013 Assessment Symposium
18Slide19
19Slide20
Questions, Comments, & Future Research I
deas
Heather Novak
Institutional ResearchHeather.Novak@colostate.edu491-2163
2013 Assessment Symposium
20