
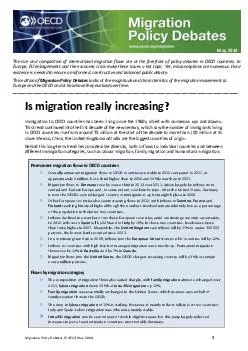
In Europe EU enlargements and the economic crisis make these issues a hot topic Yet misconceptions are numerous Hard evidence is needed to ensure an informed construct ive and balanced public debate This edition of Migration Policy Debates looks at ID: 5705
Download Pdf The PPT/PDF document "Migration Policy Debates OECD May The ..." is the property of its rightful owner. Permission is granted to download and print the materials on this web site for personal, non-commercial use only, and to display it on your personal computer provided you do not modify the materials and that you retain all copyright notices contained in the materials. By downloading content from our website, you accept the terms of this agreement.


Migration Policy Debates © OECD May 2014 1 The size and composition of international migration flows are at the forefront of policy debates in OECD countries. In Europe, EU enlargements and the economic crisis make these issues a hot topic . Yet , misconceptions are numerous. Hard evidence is needed to ensure an informed, construct ive and balanced public debate. This edition of Migration Policy Debates looks at the magnitude and characteristics of the migration movements to Europe and the OECD and at how have they evolved over time. ________ ___________________________________________________________________________________________ Is migration really increasing? Immigration to OECD countries has been rising since the 1960s, albeit with numerous ups and downs. This trend continued into the fir st decade of the new century, which saw the number of immigrants living in OECD countries rise from around 75 million at the start of the decade to more than 100 million at its close. Mexico, China, the United Kingdom and India are the biggest countries of origin. B ehind this long - term trend lies considerable diversity , both in flows to individual countries and between different immigration categories, such as labour migration, family migration and humanitarian migration. Permanent migration flows to OECD c ountries ï Overall permanent migration flows to OECD countries are stable in 2012 compared to 2011 at approximately 4 million , but a third higher than in 2000 and 14% lower than in 2007. ï Migration flows to Germany rose by over a third in 2012 over 2011, dri ven largely by inflows from c entral and E astern Europe and, to some extent, southern Europe. After the U nited States , Germany is now the OECDâs second - largest country of immigration, up from eighth place in 2009. ï Other European countries also saw increasin g flows in 2012 , with inflows to Sweden , France and Finland reaching historical highs although the number s involved remain relatively low as a percentage of the population in the latter two countries. ï Inflows declined in a number of southern European count ries, amid continuing economic uncertainty. In 2012, i nflows to Spain fell by 22% and to Italy by 19%. In these two countries, levels were more than twice higher in 2007. Meanwhile, the United Kingdom saw inflows fall by 11% to under 300 000 persons , the l owest level recorded since 2003 . ï In a continuing trend since 2008 , inflows into the European Union from non - EU countries fell by 12%. ï Inflows to countries with high levels of managed migration were mostly up. Permanent migration flows rose by 12% in Austra lia and by 7% in Canada . ï Migration flows into the United States , the OECDâs largest receiving country, fell by 3% but remain over a million persons. Flows by migration category ï The composition of migration flows also varied sharply, with family migration a lmost unchanged over 2011 , labour migration down 10% but intra - EU migration up 1 2 %. ï Family migration was essentially unchanged in the United States, which receives around half of family - reunion flows in the OECD. ï The drop in labour migration of 10% is str iking . H owever , it mainly reflects falls in just two countries : Italy and Spain. Labour migration was otherwise mainly stable. ï Intra - EU migration saw its second year of double - digit increases but this jump largely reflected increases in just a few destinat ion countries, most notably Germany. May 2014 2 Migration Policy Debates © OECD May 2014 Migration flows and immigrant populations have been increasing for decades S ince the 1960s , net migration to OECD countries has increased , although this long - term trend is characterised by some sharp fluctuations, o ften in response to the business cycle or geopolitical events . Over that same period, many OECD countries have shifted from being countries of emigration to countries of immigration. Net migration to OECD countries as a percent age of the total resident po pulation , 1959 - 2009 Source: OECD Population and Vital Statistics database. According to most recent population censuses , between 2000 /01 and 2010 /11 , the number of immigrants in the OECD increased by a round 35 % . In 2010/11 t here were more than 100 millio n foreign - born in the OECD compared to just over 75 million a decade earlier (OECD - UNDESA, 2013) . A little more than half of the foreign - born , or 52%, we re women and 75% we re aged between 25 and 64. Mexico is the main country of origin with 11 million emi grants, followed by China (3.8 million), the United Kingdom (3.5 million) and India (3.4 million) . The number of immigrants in OECD countries who were born in China, India and Romania has increased by more than 1.5 million in ten years. Overall , internatio nal migration flows to OECD countries are a third higher in 2010 than they were in 2000 . At first glance these facts may support the idea of a constant, if not accelerating, increase in migration . However, t h e situation is actually more nuanced as global migration flows to OECD have not followed a steady trend. After a strong increase at the turn of the century and a peak in 2007, they fell sharply in 2008 and 2009, in response to the global financial crisis , and then remained relatively stable until 2012. In 2012, total permanent migration flows to the OECD reached 4 million, half of which is for European OECD countries. Migration flows to the OECD area, 2000 - 201 2 Source: OECD International Migration database. Looking at the evolution by country of dest ination gives an even more complex picture. Apart from Japan and Korea, where immigration remains at relatively low and stable levels, flows to other countries show ed large variations over the first decade of the millennium. Spain displayed the widest vari ations, with inflows tripling between 2000 and 2007 before subsequently decreasing to a third of the 2007 peak . Trends observed in 2012 clearly illustrat e this responsiveness to economic conditions . The overall level of permanent international migration to OECD countries remained fairly stable in 2012 relative to 2011, dropping by only 0.4% (15 000 persons) . Y et, this overall stability hides highly diverging patterns across countries of destination and by type of migration. In fact, the heterogeneity in mig ration trends has never been as marked as today. Migration trends are diverg ing widely across countries Germany stands out among the countries where immigration increased in 2012 . F lows increas ed by over a third compared with 2011, reaching 400 000 person s. Germany be ca me the second - largest immigration country , after the United States, in the OECD in 2012, receiving more than 10% of all permanent immigration to the OECD area. In 2009, i t was only the eighth largest. This spectacular increase has been fuell ed mainly by inflows from central and eastern European countries and, to a lesser degree, southern Europe. Migration Policy Debates © OECD May 2014 3 Several other European countries also experienced significantly higher migration flows in 2012 compared with 2011, with some , such as France, Sweden and Finland, even reach ing historical highs. However, by international standards, inflows into France and Finland still represented only a small share of the se countriesâ population s â only around 0.4% of the population. Overall, this ratio varies consider ably between countries, rang ing from over 1 . 5 % of the population in Switzerland to less than 0.1% in Mexico and the Asian OECD countries. Permanent migration flows as a percentage of the population , 2012 Source: OECD International Migration database. On the other hand, three of the main European destination countries witnessed a large scale reduction of their permanent inflows. After a rebound in 2011, flows to Spain resumed their post - crisis downhill trend, falling 22% in 2012. However, that still repres ent ed just under 300 000 people , or 0.6% of the population. The second - largest decrease was in Italy, w here permanent inflows fell 19% in 2012 , to less than half what they were in 2007. In the United Kingdom, flows fell 11% in 2012 to under 300 000 persons . Between 2007 and 2011, the E uropean Union as a whole saw a decline of inflows from outside the Union of around 4% per year. In 2012, these flows dropped by 12%. In the OECD countries that have been settled by migration and where labour migration represe nts a high share of the flows â i.e. Australia, Canada and New Zealand â changes from 2011 to 2012 were more limited. Permanent migration flows to Australia increased by 12% in 2012, slightly exceeding 250 000 persons. Flows to Canada also amount ed to 250 000 persons, up 7% on 2011. T he United States remains , by far, the largest receiving country in the OECD in absolute terms, accounting for more than a quarter of total permanent flows to the OECD area . However, the migration to population ratio is low, on ly around 0.3% of the population. In 2012, migration flows declined slightly, by 3% (or 30 000 persons ) . New Zealand is the only settlement country where permanent flows have steadily decreased since 2005. However, at 42 000 in 2012 , they still represent ed almost ten immigrants per thousand population. Big variations in trends across different migration categor ies Family migration continues to be the main component of international migration flows. Migration flows for family reasons were fairly stable in 20 12, slipping just 1% . By contrast, migration within free - movement zones went up 10% , while managed labour migration decreased by 10%. Never before have these three major migration channels displayed such different trends. Permanent immigration in OECD coun tries by category, 2007 - 2012 Source: OECD International Migration database. In recent years, the United States has received more than half of the permanent family migration flows to the OECD. In 2012, 680 000 family members of US citizens or permanent res idents obtained legal permanent resident status in the U nited States , unchanged from 2011 and 2010. M any other OECD countries have witnessed strong variations in family migration. Flows in this category rose sharply in Sweden , up 26% ; Switzerland , up 16% ; and Canada , up 15% . They also rose, although less sharply, in Australia and in France , which each saw increases of 7%. On the other hand, family migration dropped sharply in Spain, probably in response to the economic situation . Family migration also decre ased in some other European count rie s, for example Belgium and Portugal . 4 Migration Policy Debates © OECD May 2014 Permanent labour migration is decreasing International migration to OECD countries in 2012 was marked by a notable fall in permanent labour migration. OECD countries received 10% few er permanent workers in 2012 than in 2011. But this should not be seen as a sign of a general trend, as the decline wa s driven mostly by just two countries, Italy and Spain. Labour migration to Italy returned to its pre - 2007 level, just below 60 000, with a drop of over 40% compared with 2011. However, labour migration still account ed for 37% of non - free movement migration to Italy, just above the figure for the European Economic Area as a whole of 36%. In Spain, labour migration fell by 17% but remain ed at a relatively high level of 112 000. Otherwise, labour migration remained fairly stable in many OECD countries such as the United States, the United Kingdom, the Netherlands, New Zealand, Belgium and Ireland. Among the large immigration countries, Austral ia and Canada saw labour migration rise by 6%. Austria and Japan saw large increases , about 20%, but from very low levels. Free - movement migration is increasing again While it remains far from its pre - crisis level, free - movement migration, in particular w ithin the E uropean Union , has soared again in 2012 . A total of 9 25 000 EU citizens emigrated to another EU country in 2012 , up 12% over the previous year . This was the second consecutive year of double - digit increase s . This increase is, however, concentra ted in few European destination countries. In absolute terms, the overall increase of EU free - movement stands just below 100 000, which correspond more or less to the increase recorded in Germany alone. M ore than 300 000 EU citizens e migrated to Germany in 2012, making it the second consecutive year with an increase of around 50%. Partial figures for migration to Germany in 2013, published by the German S tatistical O ffice, suggest the upward trend continues, although perhaps not at the same magnitude. Indee d, whereas flows from Poland seem to have stabilise d , flows from other major sending European countries may have continue d to rise. Flows to Germany from some European countries and regions , 2010 - 2013 Source: German Statistical Office (Destatis) . In abs olute terms, variations in other countries have not been particularly significant, except in Spain, where 116 000 EU citizens settled in 2012, still a high level, but down 22% on 2011. Flows of EU nationals to Italy went down 9%, while those to France went up by 11%, equivalent to just below 100 000 people in both countries. Permanent migration to the United Kingdom from other European countries has remained stable since 2009, at around 75 000 . ï¦ References OECD - UNDESA (2013), World Migration in Figures , O ECD/United Nations Department of Economics and Social Affairs, www.oecd.org/els/mig/World - Migration - in - Figures.pdf . OECD (2013), International Migration Outlook 2013 , OECD Publishing, Paris, http://dx.doi.org/10.1787/migr_outlook - 2013 - en . OECD (2014 forthc oming), International Migration Outlook 2014 , OECD Publishing , Paris , http://dx.doi.org/10.1787/migr_outlook - 2014 - en . OECD (2011), Labour Force Statistics , http://dx.doi.org/ 10.1787/lfs - lfs - data - en . ïª Contacts Jean - Christophe Dumont (International Migratio n Division, OECD) Email: jean - christophe.dumont@oecd.org Tel: +33 1 45 24 92 43 ï¸ Useful links www.oecd.org/migration This paper is published under th e responsibility of the Secretary - General of the OECD. The opinions expressed and the arguments employed herein do not necessarily reflect the official views of OECD member countries. This document and any map included herein are without prejudice to the status of or sovereignty over any territory, to the delimitation of international frontiers and boundaries and to the name of any territory, city or area.