
Exhibit 1 The Number of Uninsured People Under Age 65 Declined to 275 Million in 2016 Source US Census Bureau 2013 2014 2015 and 2016 Table 2 Current Population Survey Reports Exhibit 2 ID: 637793
Download Presentation The PPT/PDF document "Source: Source: U.S. Census Bureau, 20..." is the property of its rightful owner. Permission is granted to download and print the materials on this web site for personal, non-commercial use only, and to display it on your personal computer provided you do not modify the materials and that you retain all copyright notices contained in the materials. By downloading content from our website, you accept the terms of this agreement.


Slide1
Source:
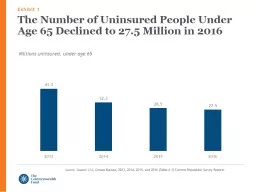
Source: U.S. Census Bureau, 2013, 2014, 2015, and 2016 (Table A-1) Current Population Survey Reports
Exhibit 1
The Number of Uninsured People Under Age 65 Declined to 27.5
Million
in 2016Slide2
Source: U.S. Census Bureau, 2013, 2014, 2015, and 2016 (Table 2) Current Population Survey Reports
Exhibit 2
Uninsured Rates Fell Across
All
Age
Groups;
Young Adults Have Made the Greatest Gains
Since 2013
AgeSlide3
Note: White and African Americans only includes those who are White or African American alone.
Source: U.S. Census Bureau, 2013, 2014, 2015, and 2016 Current Population Survey Reports and from CPS’s table creator at http://www.census.gov/cps/data/cpstablecreator.html
Exhibit 3
Uninsured Rates Fell Across
All
Race and Ethnic
Groups; African-Americans
and Latinos Have Made the Greatest Gains Since 2013
Race/EthnicitySlide4
Source: U.S. Census Bureau, 2013, 2014, 2015, and 2016 Current Population Survey Reports and from CPS’s table creator at http://www.census.gov/cps/data/cpstablecreator.html
Exhibit 4
People with Low Incomes Continue to Make Strong Coverage Gains
IncomeSlide5
2013
2016Uninsured Rates Declined Nationwide from 2013 to 2016
Exhibit 5
*Medicaid expansion status as of January 1, 2016.
Of the 20 states that had not expanded eligibility for Medicaid under the ACA as of January 2016, uninsured rates exceeded the national average in 17 of them. Louisiana has since expanded its program.
Source:
Health Insurance Coverage in the United States:
2016. U.S. Census Bureau, 2013 and 2016 American Community Surveys.
3%—≤8% uninsured
8
%—<10.5%
uninsured
10.5%—≤14
%
uninsured
>
14%
uninsured
Not
expanding
Medicaid*Slide6
Are you aware of the marketplaces also known as
HealthCare.gov
or the marketplace in your state?
Two of Five Uninsured Adults Are Not Aware of the Marketplaces
Exhibit 6
Notes: FPL refers to federal poverty level. 250% of FPL is $29,700 for an individual or $60,750 for a family of four.
Data: The Commonwealth Fund Affordable Care Act Tracking Survey, March–June 2017.
Income
Race
AgeSlide7
Adults Who Received Personal Assistance Were More Likely to Enroll
Exhibit 7
Notes: * Personal assistance includes a telephone hotline, insurance broker, navigator, or some other form of assistance. Percentages were adjusted for race, education, poverty, age and health status. “Obtained coverage” includes those who visited the marketplace and have had marketplace or Medicaid coverage. We do not include adults who said they did not obtain coverage because they receive coverage through a different source.
Data: The Commonwealth Fund Affordable Care Act Tracking Survey, March–June 2017.
When you shopped for health insurance, did you ever receive any personal assistance* to help you select an insurance plan?