
19982001 2007 2008 Intrusions after strong Nward then Sward wind 48 Intrusions per summer from RIS 19982001 2007 2008 Intrusions after strong Nward then Sward wind Intrusion event estimate cross section is from average conditions ID: 321884
Download Presentation The PPT/PDF document "4-8 Intrusions per summer from RIS" is the property of its rightful owner. Permission is granted to download and print the materials on this web site for personal, non-commercial use only, and to display it on your personal computer provided you do not modify the materials and that you retain all copyright notices contained in the materials. By downloading content from our website, you accept the terms of this agreement.


Slide1Slide2
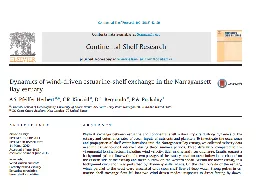
4-8 Intrusions per summer from RIS
1998-2001, 2007, 2008
Intrusions after strong N-ward, then S-ward windSlide3
4-8 Intrusions per summer from RIS
1998-2001, 2007, 2008
Intrusions after strong N-ward, then S-ward windSlide4
Intrusion event estimate. (cross section is from average conditions,
actual event likely to occupy larger cross section, conservative est.). 1000m x 25m x 0.15 m/s = 3750 m^3/s2 day average duration. 172800 seconds.
Volume of intruded water: 648 million m^3.NB volume is 2 billion m^3. This represents ~ 30% of the volume of the Bay.Point: We currently have no idea what (nitrogen, S, T,
Larvae, plankton, HABs, etc) enters with these intrusions.
Intrusion width
Intrusion depthIntrusion Mean flowSlide5
Nixon and others measured DIN in RIS. High levels.
7
microMSlide6
Time Series
Sample Proposal
Omand
, Kincaid, Ullman, Fulweiler, GrearCurrents
Pumped from 3 depths to in-line sensors: oxygen nitrogen phytoplankton
other key fieldsSlide7
HIGH DIN
DIN to
Euphotic zone?
West Passage
East Passage
Prudence
JamestownSlide8
HIGH DINSlide9