
9192018 1 Outline Components of Mortality Mortality measures Years of potential life lost Sources of statistics on mortality 9192018 2 Components of Mortality There are two biological aspects of mortality ID: 915857
Download Presentation The PPT/PDF document "The Measures of Mortality" is the property of its rightful owner. Permission is granted to download and print the materials on this web site for personal, non-commercial use only, and to display it on your personal computer provided you do not modify the materials and that you retain all copyright notices contained in the materials. By downloading content from our website, you accept the terms of this agreement.


Slide1
The Measures of Mortality
9/19/2018
1
Slide2Outline Components of Mortality
Mortality measures
Years of potential life
lostSources of statistics on mortality
9/19/2018
2
Slide3Components of Mortality There are two biological aspects of mortality: 1. Lifespan:
refers to the oldest age to which human beings can survive (how long a person can possibly be alive). 2. longevity :
refers to the ability to remain alive from one year to the next.
The proportion of people who are actually able to approach that upper age limit is governed by a combination of biological (e.g. genetics, vital organs strength .. ) and Social ( e.g. lack of stress) factors.
9/19/20183
Slide49/19/20184
- Mortality is a term which means “death” or describes death and related issues.
Slide59/19/20185
Why look at mortality rates?
1. Expressing
mortality in quantitative terms allow comparison of death:
A. Between people in different geographic areas or different countries.
B. Between
subgroups in the a population or country.
Slide69/19/20186
2- Mortality rates can serve as a disease Severity, and can help to determine of whether the treatment for a disease has become more effective over time.
Slide7Crude rates:
H
ow are
they calculated?
Crude rates are calculated for the entire population.
Refer to as crude because:
They ignore factors which may
affect
death rate such as: gender, age, race, economic status
….
9/19/2018
7
Slide8Crude
Death rate (CDR):
Number of all deaths due to all causes in a certain year and within certain locality
Mid-year population for the same year and same locality
9/19/2018
8
x 1000
Example:
Suppose area X in
1438
H, we have:
1- 1200 deaths, all causes.
2- The area's mid year population was 150,000.
Slide93-
Find
crude death rate in
1438
H
?
Numerator: number of deaths all causes
= 1200
Denominator: Mid-year population =150,000
9/19/2018
9
CDR =
1200
x 1000 = 8/1000;
150,000
that is, 8 deaths per 1000 population.
Slide109/19/201810
السنة
سعوديون
غير سعوديين
الجملة
SAUDI
NON-SAUDI
TOTAL
YEAR
ذكور
اناث
جملة
ذكور
اناث
جملة
ذكور
اناث
جملة
MALE
FEMALE
TOTAL
MALE
FEMALE
TOTAL
MALE
FEMALE
TOTAL
2004
4.7
3.9
4.3
3.4
3
3.3
4.3
3.8
4
2005
4.7
3.94.33.42.93.34.23.7420064.63.84.23.42.93.24.23.7420074.63.84.23.42.83.24.23.63.920084.53.74.13.52.83.34.23.63.920094.53.74.13.52.73.34.23.53.920104.43.74.13.62.73.34.23.53.9
CMR
By Sex And Nationality
In
The
KSA
(2004 to 2010)
Slide119/19/201811
Country
Crude death rate
Crude birth rate
Infant mortality rate
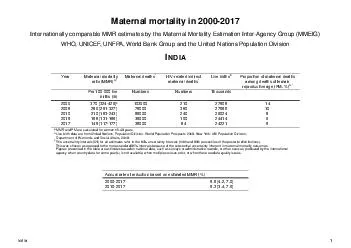
Maternal mortality rate
Per 1000
Per 1000
Per 1000
Per 100,000
Saudi Arabia
3.8
22.1
18.5
16
Yemen
7.0
38.6
53.3
200
Palestine
3.6
35.9
22.2
32
Iraq
6.3
36.6
34.6
63
Bahrain
2.8
20.7
7.0
20
Emirates
1.4
14.010.912Oman3.822.218.511Qatar1.614.19.06Jordon26.44.121.063
Slide129/19/201812
Why Mid-year population?
For example, for the crude death rate the number of persons exposed to the risk of dying (denominator): includes: Persons alive in Muharram 1 of the year previous year.
Slide139/19/201813
plus
all persons born during year
minus
all persons who die during year,
adjustments made for persons who moved in or out.
Slide149/19/201814
A common solution to this problem of determining the population at risk is to estimate the population at mid-year.
In our example (
1438H
):
T
he population at risk will be the population on Rajab1.
Slide159/19/201815
Cause-specific Mortality Rate
• Is Mortality from a specified cause for a population during a specified time period.
• The numerator is the number of deaths from that cause.
The denominator remains the size of the population at the mid-point of the time period.
Slide1616
Example: In the previous example: suppose the tuberculosis death in
1438H
was 5.
Calculate mortality rate due to TB.
Numerator: number of deaths due to TB = 5
Denominator: Mid-year population 150,000
Mortality rate due to TB =
(5/150,000) x 100,000 = 3.3/100,000
Slide179/19/201817
The Age Specific Death Rate
Where:
ASDR
= The Age Specific Death Rate.
D
x
= Deaths for population at age x during
the
year.
P
x
= Mid year Population for the population
at
age x
Slide189/19/201818
Deaths
Mid year Population
Age Group
4143
73795
19 – 15
4740
48764
24 – 20
4304
43635
29 – 25
3883
63337
34 – 30
4062
34423
39 – 35
4597
26983
44 – 40
5085
24548
49 - 45
Deaths
during the year and the population at the mid year for the different age groups
Slide199/19/201819
ASDR
Death
Mid year Population
Age Group
56
4143
73795
19 – 15
97
4740
48764
24 – 20
99
4304
43635
29 – 25
61
3883
63337
34 – 30
118
4062
34423
39 – 35
170
4597
26983
44 – 40
207
5085
24548
49 - 45
The age Specific Death Rates
Slide209/19/201820
Why Age Specific Death Rates
?
Can
compare mortality at different ages.
Can
compare mortality in the same age groups over time and/or between countries and areas
Slide213-
Infant mortality rates (IMR):
9/19/2018
21
Are
the most common used rates for measuring the risk of dying during the first year of life.
These
rates are
the
most frequently used measures for comparing health services among nations.
Slide229/19/201822
Infant Mortality Rate , Saudi Arabia (2000-2011)
Slide23High infant mortality rates are:
1- Reflection of poor economic conditions2- unmet health care needs and
3- other unfavorable environmental factors.
9/19/2018
23
IMR =
number of infant deaths
age 0-365 days
Number of live
births during year
1000
X
Slide249/19/201824
Country
Infant mortality rate
Per 1000
Saudi Arabia
18.5
Yemen
53.3
Palestine
22.2
Iraq
34.6
Bahrain
7.0
Emirates
10.9
Oman
18.5
Qatar
9.0
Slide25Suppose at KKU hospital, 20 infants died during
1438H
. The number of live births for the same year was 2600. Calculate IMR
9/19/2018
25
Numerator: number of infants died = 20
Denominator: Number of live births = 2600
IMR
=
20
x 1000
=
7.7
/
1000
2600
Slide26That is; 7.7 infant deaths per 1,000 live births in
1438H
.
9/19/2018
26
Neonatal mortality rate
(NMR
)
:
Measures risk of dying among new born infants under the age 28 days.
Slide279/19/201827
number of deaths for infants under 28 days of age
Number of live birth in the
same year
x 1,000
NMR
=
Example: In the previous example:
suppose out of the 20 who died, 12 died in the first 28 days. Calculate NMR for
1438H
.
Slide289/19/201828
Numerator: number died in ( 0- 28) days = 12
Denominator: Number of live births = 2600
NMR =
12
x 1,000 = 4.6/1000
2600
4.6 deaths per 1,000 live births.
Slide299/19/201829
Postneonatal
mortality rate (PNMR
):
Number who
died after 28 days of age.
For
the previous example:
T
he number of infants who died after 28 days of age is 8. (20 - 12 = 8).
Slide309/19/201830
x 1,000 = 3.1/1000
3.1/1000 deaths per 1,000 live births.
PNMR =
12
2600
PNMR =
deaths for infants more than 28 days old through the age of 1 year
Number of live birth in the same year
x 1,000
Slide319/19/201831
Maternal
Mortality
Definition
:‘Maternal death
’ is death of a woman
while
pregnant ,or
within
42 days of termination of
pregnancy.
Irrespective
of the duration or site of the
pregnancy.
Slide329/19/201832
From any cause related to, or aggravated by the pregnancy or its management
Not
from accidental causes
Slide339/19/201833
Maternal Mortality Indicators
Maternal
mortality
ratio
(per 100,000 live births -or per 1000 live births)
Maternal
mortality
rate
(
per 100,000 women of childbearing age)
Slide349/19/201834
Maternal Mortality Ratio
Number
of women who die as a result of complications of pregnancy or childbearing in a given year per 100,000
live
births in
that
year
Represents
the risk associated with each pregnancy, i.e., the obstetric
risk
Slide359/19/201835
The numerator is the number of deaths in a year from puerperal causes. (complications of pregnancy,
childbirth).
The denominator is the number of live births during the same year.
Slide369/19/201836
MMRatio
=
T
otal maternal deaths for a period (year)
x 100,000
Number of live birth in the
same year
Example:
The year-end of
1438H
report from the obstetrical ward:
Slide379/19/201837
1-
was 3 deaths (2 abortions, 1 pregnancy complications).
2-
The number of live born was as before (2600).
Numerator: number of mothers died = 3
Denominator: Number of live births = 2600
x 1,000 = 1.15/1000
MMRatio
=
3
2600
1.15/1000 maternal deaths per 1,000 live births
Slide389/19/201838
Maternal
Mortality
Rate
Number of women who die as a result of complications of pregnancy or childbearing in a given year per 100,000
women of childbearing
age
in
the
population
Represents
both the obstetric risk and the frequency with which women are exposed to this
risk.
Slide399/19/201839
Country
Maternal mortality
rate
Per 100,000
Saudi Arabia
16
Yemen
200
Palestine
32
Iraq
63
Bahrain
20
Emirates
12
Oman
11
Qatar
6
Slide409/19/201840
MMRate
=
T
otal maternal deaths for a period (year)
x 100,000
Number of women age 15 - 49
Example:
The year-end of
1438H
report from the obstetrical ward:
Slide419/19/201841
1-
was 10 deaths (2 abortions, 8 pregnancy complications).
2-
The number of women aged 15-49 was: (250000).
MMRate
=
10
250000
x 100,000
= 4/100,000
Slide429/19/201842
Case- fatality rate
(CFR):
(expressed usually as percent):
CFR =
x 100
Number of individuals with the specified disease
Number of deaths during a specified period of time after disease diagnosed
Slide43Example 1: At X city:
1)
110 cases of cancer in 1433H
2) 29 died in 1433H.
Find CFR:
CFR = 29 x 100 = 26.4%
110
Numerator: # died of cancer = 29
Denominator: Number with cancer = 110
43
Slide449/19/201844
Proportionate Mortality (PM):
T
he
proportionate of mortality from specified disease is defined as:
PM =
Number of deaths from a disease during a specified period of time
Total deaths in the same time period
x 100
Slide459/19/201845
Example 1: At X city:
1)
10 deaths from cardiovascular disease in 1427
2) 500 deaths from all diseases in 1427
Find
PM
:
PM = 10 x 100 = 2%
500
Slide469/19/201846
Years of potential life lost (YPLL)
Is a measure of early deaths.
Death occurring in the same person at a younger age involves a greater loss of future productive years than death occurring at an older age.
Steps in calculation of YPLL:
1- subtract each person’s death from predetermined age (differs according to country).
Slide479/19/201847
The younger the age at which death occurs, the more years of potential life are lost.
2- ‘YPLL’ for each individual are then added together to yield the total YPLL.
For example a person died at age 32, and suppose the predetermined age is 65, then this person has lost (65 – 32) = 33 years of life.
Slide489/19/201848
Example:
5 workers died because of exposure to toxic chemical.
The ages of death were 20, 25, 30, 35, and 40 years.
Use age 65 as the predetermined age.
Calculate the YPLL for these 5 workers. And so find the mean YPLL.
Slide499/19/201849
YPLL = (65 – 20) + (65 – 25) + (65 – 30) + (65 – 35) + ( 65 – 40) = 175.
2- The mean YPLL = 175/5 = 35
On average, the number of years of premature death among those workers who died is 35 years.
Slide509/19/201850
Country
Sex ratio
Life expectancy
Total fertility rate
Male
Female
Saudi Arabia
105 : 100
71
75
3.03
Yemen
105 : 100
61
60
5.48
Palestine
106 : 100
73
77
4.65
Iraq
105 : 100
70
73
4.86
Bahrain
103 : 100
76
81
2.63
Emirates
105 : 100
75
80
2.36Oman105 : 10075772.52Qatar102 : 10074771.92Jordon106 : 10079823.27
Slide519/19/201851
Sex differentials:
The average life expectancy of females is greater than that of males, partly due to biological factors and partly because of behavioral differences.
Men smoke more tobacco, drink alcohol, have more motor vehicle accidents, engage in more
Slide529/19/201852
dangerous occupation and are more prone to suicide.
There is an Excess male mortality in many countries.
Comparing the number of male deaths with the number of female deaths can be misleading due to sex ratio (more male babies being born and hence more deaths.
Slide539/19/201853
To avoid the effect of sex ratio in mortality rate comparisons, the sex ratio of the age specific death rate, which is used to measure male excess mortality.
This is obtained as:
Male excess mortality =
Male death rate at age x
female death rate at age x
x 100
Slide549/19/201854
For example, a male excess mortality of 150 would denote that the male death rate was 50% higher than the corresponding death rate for females.
Slide559/19/201855
Male excess
mortality
Deaths
Mid year Population
females
Males
Females
Males
2.85
12
36
8651
9103
3.09
15
48
9345
9676
2.83
21
60
10617
10696
2.69
27
72
10986
10877
2.59
33
84
10061
9902
1.98
45
90
892486921.80579970626811
Slide569/19/201856
Sources of statistics on mortality
1- Death certificate:
Specifies a number of demographic and social characteristics of the deceased and details about the cause of death.
Death certificate can also include:
birth place, marital status, education, residence, occupation
.
Slide579/19/201857
2- Vital statistics:
Include mortality data on the number and causes of deaths, together with the age and sex of the deceased.
3- Cross-national data:
Comparative data on mortality are published in the United Nation Yearbook and WHO Health Statistics Annual.