
Dose response curves after single dose SD application under clamp conditions with black and without green WBI Symbols observed local control rates curves calculated local tumour control ID: 796841
Download The PPT/PDF document "p=0.83 Supplementary Figure 1: Effect of..." is the property of its rightful owner. Permission is granted to download and print the materials on this web site for personal, non-commercial use only, and to display it on your personal computer provided you do not modify the materials and that you retain all copyright notices contained in the materials. By downloading content from our website, you accept the terms of this agreement.


Slide1
p=0.83
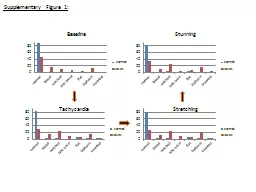
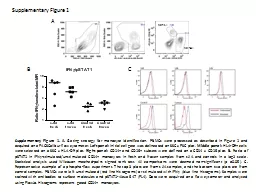
Supplementary Figure 1: Effect of whole body irradiation (WBI) on local tumour control for SAT
.
Dose response curves after single dose (SD) application under clamp conditions with (black) and without (green)
WBI
.
Symbols: observed local control rates; curves:
calculated local tumour control
probabilities
(TCP);
error bars represent
95
%
confidence intervals
(
CI)
of the tumour control
dose 50% (TCD
50
)
value
.
Slide2CAL-33
UT-SCC-15
XF354
UT-SCC-14
UT-SCC-8
SAT
UT-SCC-45
UT-SCC-5
SAS
FaDu
EGFR
CEP-7
EGFR
CEP-7
EGFR
CEP-7
EGFR
CEP-7
EGFR
CEP-7
XF354 UT-SCC-15
UT-SCC-8
SAT UT-SCC-45 UT-SCC-5 SAS FaDu
UT-SCC-14 CAL-33
Ratio
EGFR
/ CEP-7
normal
CEP-7
CEP-7
CEP-7
CEP-7
CEP-7
EGFR
EGFR
EGFR
EGFR
EGFR
Supplementary Figure
2
:
EGFR
amplification status (
EGFR
/CEP-7
ratio)
for 10 tumour
models was
identified using
FISH analysis.
FISH values from UT-SCC-15, SAS, FaDu, UT-SCC-14 and CAL-33 were taken from Gurtner et al. [
14]
amplified