
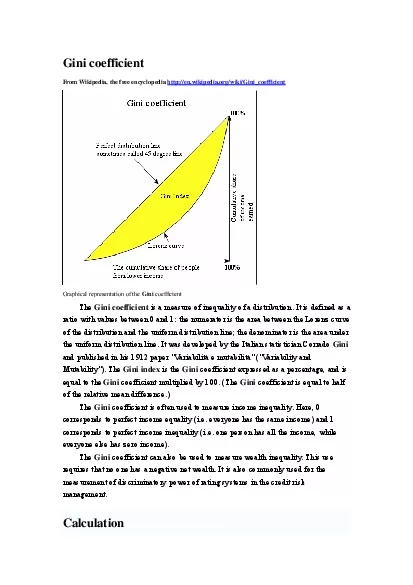
diagram If the area between the line of perfect equality and Lorenz curve is A and the area under the Lorenz curve is B then the Gini coefficient is AAB Since AB 05 the Gini coefficient G 2A 12B ID: 858957
Download Pdf The PPT/PDF document "The Gini coefficient is defined as a rat..." is the property of its rightful owner. Permission is granted to download and print the materials on this web site for personal, non-commercial use only, and to display it on your personal computer provided you do not modify the materials and that you retain all copyright notices contained in the materials. By downloading content from our website, you accept the terms of this agreement.


1 The Gini coefficient is defined as a rat
The Gini coefficient is defined as a ratio of the areas on the Lorenz curve diagram. If the area between the line of perfect equality and Lorenz curve is A, and the area under the Lorenz curve is B, then the Gini coefficient is A/(A+B). Since A+B = 0.5, the Gini coefficient, G = 2A = 1-2B
2 . If the Lorenz curve is represented by
. If the Lorenz curve is represented by the function Y = L(X), the value of B can be found with integration and: In some cases, this equation can be applied to calculate the Gini coefficient e Lorenz curve. For example: For a population with values yi, i = 1 to n, that are indexed in
3 non-decreasing ): For a discrete p:
For a discrete p")
non-decreasing ): For a discrete probability function f(y), where yi, i = 1 to n, are the points with ): where: and For a cumulative distribution function ) that is piecewise differentiable, has a mean Since the Gini coefficient is half the relative mean difference, it can
4 also be calculated using formulas for t
also be calculated using formulas for the relative mean difference. For a random sample , that are indexed in ), the statistic: : the Gini coefficient does not consider the size of the economy, the way it is measured, country on average. : it does not matter how large the populatio
5 n of the country is. Transfer princip
n of the country is. Transfer principle: if income (less than the difference), is transferred from a rich person to a poor person the resulting distribution is more equal. Disadvantages as a measure of inequality The Gini coefficient measured for a large economically diverse country
6 will generally result in a much higher
will generally result in a much higher coefficient than each of its regions has individually. For this reason the scores within the EU are difficult to compare with the score of the entire US. Comparing income distributions among countries may be difficult because benefits systems may d
7 iffer. For example, some countries give
iffer. For example, some countries give benefits in the form of money while others give food stamps, which may not be counted as income in the Lorenz curve and therefore not taken into account in the Gini coefficient. The measure will give different results when applied to individuals i
8 nstead of households. When different po
nstead of households. When different populations are not measured with consistent definitions, comparison is not meaningful. The Lorenz curve may understate the actual amount of inequality if richer households are able to use income more efficiently than lower income households. From a
9 nother point of view, measured inequalit
nother point of view, measured inequality may be the result of more or less efficient use of household incomes. As for all statistics, there will be systematic and random errors in the data. The meaning of the Gini coefficient decreases as the data become less accurate. Also, countries
10 may collect data differently, making it
may collect data differently, making it difficult to compare statistics between countries. Economies with similar incomes and Gini coefficients can still have very different income distributions. This is because the Lorenz curves can have different shapes and yet still yield the same Gi
11 ni coefficient. As an extreme e a highe
ni coefficient. As an extreme e a higher level of social and economic Rank Richest 10% 10% Richest 20% 20% Denmark Czech Republic Bosnia and Herzegovina Germany Romania South Korea Sri Lanka 73 Turkmenistan Zambia (SAR) 43.4 Côte dIvoire Cameroon People's Republic
12 of China Philippines Guinea-Bissau Mal
of China Philippines Guinea-Bissau Malaysia Costa Rica Zimbabwe Gambia Papua New Guinea Dominican Republic El Salvador Guatemala Panama ÌË¸Ë´Ì Ê³Ê³ ËËËËʳʳËËËË ËËËË Ê³Ê³ËËËËËËËʳʳËËËËËËËʳʳËËËËËËËËʳʳËËËËËËËËʳʳËËËËËËËËʳʳË
13 ËËËËËËËʳʳËËËËËËËËʳʳË
ËËËËËËËʳʳËËËËËËËËʳʳËËËË Ë ËËËʳʳËËËËË ËËËʳʳËËËËË ËËË Ê³Ê³ËËËËËË ËËËʳʳËËËËËË ËËËʳʳËËËËË Source: Ravallion and Chen, 2004. China Statistical Yearbook (State Statistical and 19972001).http://www3.nccu.edu.tw/~jthuang/inequality.