
Cottell JL Webber MA Coldham NG Taylor DL CerdeñoTárraga AM Hauser H et al Complete Sequence and Molecular Epidemiology of IncK Epidemic Plasmid Encoding blaCTXM14 Emerg Infect Dis 2011174645652 httpsdoiorg103201eid1704101009 ID: 1045580
Download Presentation The PPT/PDF document "Figure 3 Figure 3. Phylogenetic..." is the property of its rightful owner. Permission is granted to download and print the materials on this web site for personal, non-commercial use only, and to display it on your personal computer provided you do not modify the materials and that you retain all copyright notices contained in the materials. By downloading content from our website, you accept the terms of this agreement.


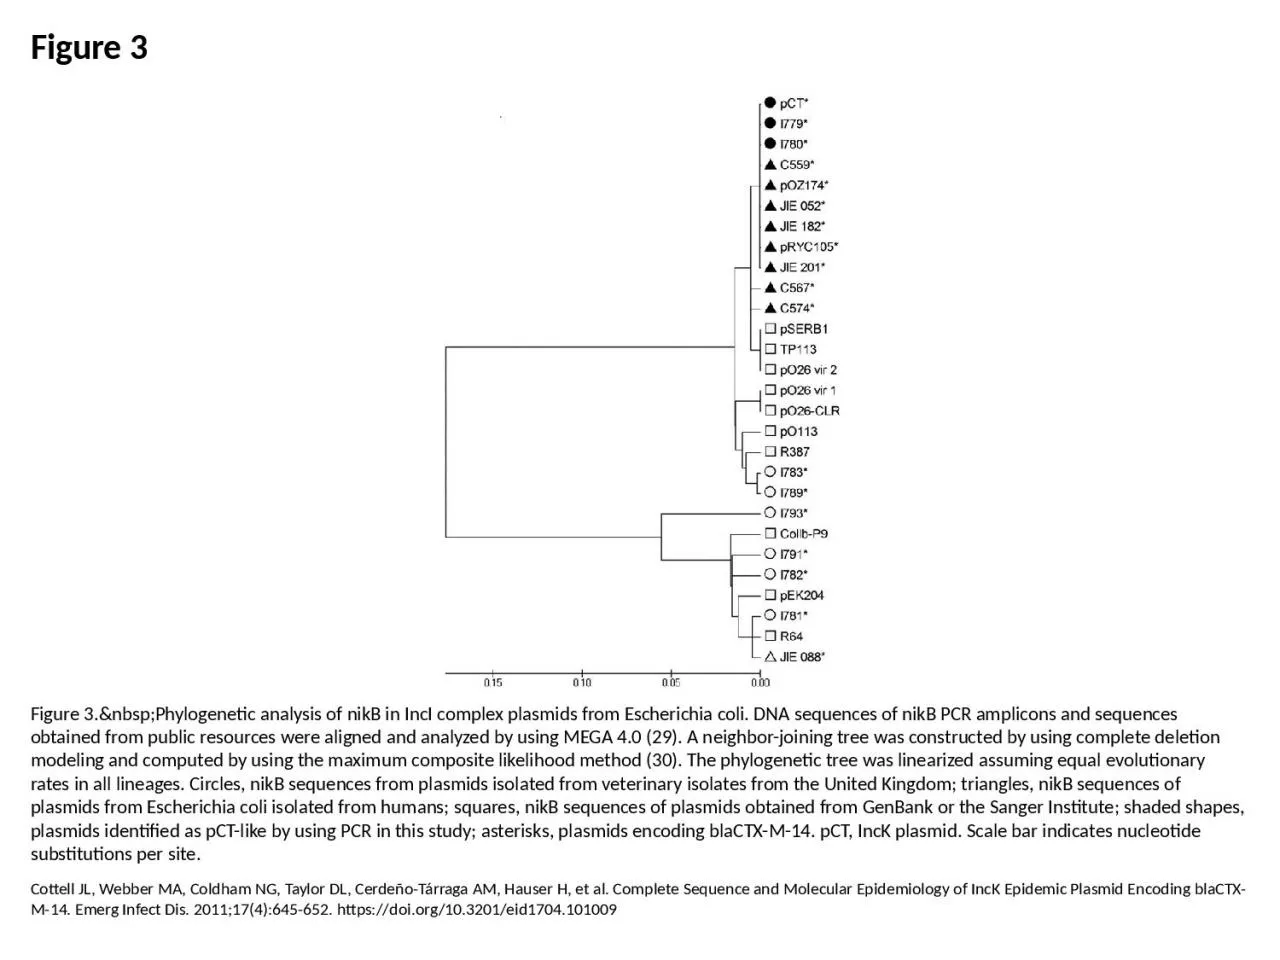
1. Figure 3Figure 3. Phylogenetic analysis of nikB in IncI complex plasmids from Escherichia coli. DNA sequences of nikB PCR amplicons and sequences obtained from public resources were aligned and analyzed by using MEGA 4.0 (29). A neighbor-joining tree was constructed by using complete deletion modeling and computed by using the maximum composite likelihood method (30). The phylogenetic tree was linearized assuming equal evolutionary rates in all lineages. Circles, nikB sequences from plasmids isolated from veterinary isolates from the United Kingdom; triangles, nikB sequences of plasmids from Escherichia coli isolated from humans; squares, nikB sequences of plasmids obtained from GenBank or the Sanger Institute; shaded shapes, plasmids identified as pCT-like by using PCR in this study; asterisks, plasmids encoding blaCTX-M-14. pCT, IncK plasmid. Scale bar indicates nucleotide substitutions per site.Cottell JL, Webber MA, Coldham NG, Taylor DL, Cerdeño-Tárraga AM, Hauser H, et al. Complete Sequence and Molecular Epidemiology of IncK Epidemic Plasmid Encoding blaCTX-M-14. Emerg Infect Dis. 2011;17(4):645-652. https://doi.org/10.3201/eid1704.101009