
Helen Dahlke Assistant Professor in Integrated Hydrologic Sciences Dept of Land Air and Water Resources UC Davis Soil Storage and SurfaceGround Water Interactions December 9 2014 Email ID: 1045983
Download Presentation The PPT/PDF document "The Dilemma of Water Management –" is the property of its rightful owner. Permission is granted to download and print the materials on this web site for personal, non-commercial use only, and to display it on your personal computer provided you do not modify the materials and that you retain all copyright notices contained in the materials. By downloading content from our website, you accept the terms of this agreement.


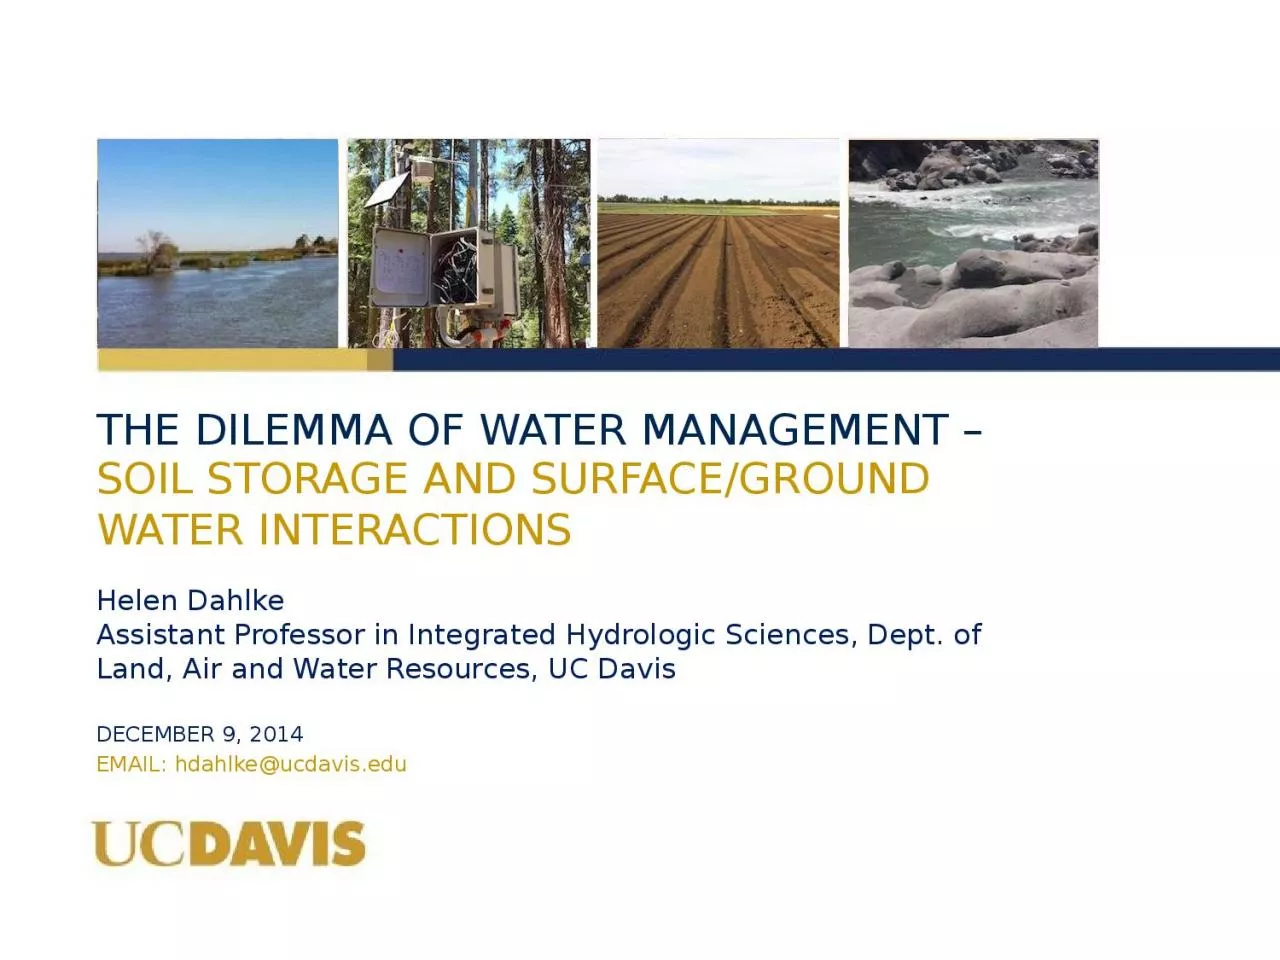
1. The Dilemma of Water Management – Helen DahlkeAssistant Professor in Integrated Hydrologic Sciences, Dept. of Land, Air and Water Resources, UC DavisSoil Storage and Surface/Ground Water InteractionsDecember 9, 2014Email: hdahlke@ucdavis.edu
2. May 2014Aug 2014Nov 2013Aug 2013Signs of a 3-year drought – NOAA drought indexJan 2014Dec 2014Source: www.watereducation.org
3. How did we get here?Precipitation~ 200 MAFEvapotranspiration~ 125 MAFWater available as runoff ~ 75 MAFThe California Water Budget3 Storages in CaliforniaRUNOFFNO RUNOFFSNOWRESERVOIRSGROUNDWATER
4. Changes in cropping patterns in the Sacramento ValleyCrop2003-052009-12 ChangeDeciduous Nuts & Fruits219,182258,11338,931Olive & Citrus28,99737,0028,005Vineyard4,0003,676-324Rice348,389350,3161,927Pasture112,623127,52814,905Grain & Hay71,77461,434-10,340Field Crops58,44037,874-20,566Truck Crops33,78833,594-194Idle Land32,20426,609-5,595Total909,397936,14626,749Source: Northern Region, Land Use Section, 2012Average values (in acres) for five northern Sacramento Valley counties.
5. Average values (in acres) for five northern Sacramento Valley counties.Irrigation Method2003-052009-12 ChangeBasin Flood353,691354, 238547Surface Drip60,23283,39323,161Micro Sprinkler46,72588,39041,665Border Strip117,52176,581-40,940Furrow87,91259,392-28,520Hand Move Sprinkler24,70419,609-5,095Buried Drip6002,5151,915Solid Set Sprinkler1,6241,588-36Source: Northern Region, Land Use Section, 2012Changes in irrigation methods in the Sacramento Valley
6. Advantages:Reduced crop stress, more efficient crop fertilizationIncreased yields, improved crop qualityMore food grown per unit of water and landImportant to feed growing US and world populationEven though acreage of perennial crops in CA has increased in the 2000’s, the total water going to CA farms has held steady.In the last 20 years, almond growers have reduced the amount of water they use per pound of almonds by 33% Farm level decisions are part of active soil storage and groundwater management – Example: Conversion from flood to drip and micro irrigation in CA agriculture
7. Consequences (unintended) of drip/micro irrigation :Less deep percolation of water protects groundwater quality but decreases groundwater recharge Irrigation “inefficiency” is a major source of groundwater recharge!More reliance on groundwater than surface water for drip/micro-irrigationLarge uncertainty about surface water availability (for many reasons)More flexibility to meet high frequency, low volume demand of drip and micro irrigationLess filtering and clogging problems with drip and micro irrigationFarm level decisions are part of active soil storage and groundwater management – Example: Conversion from flood to drip and micro irrigation in CA agriculture
8. What is groundwater banking?…is the active and intentional recharge of groundwater aquifers during years when rainfall is abundant to increase water supply reliability during drought years GeneralHave a void in a groundwater aquifer to store rechargeHave source of surface water to infiltrate and rechargeBanking implies a savings account for a “not so rainy day”Water banking implies managing for a drought when a drought is not occurring.Less costly than surface storageEcosystem advantagesMany forms of bankingNatural rechargeDirect percolation rechargeIn-lieu rechargeFallowingAquifer injection
9. Concept of groundwater banking (GB) through active groundwater management (Source: Sacramento Valley Groundwater Assessment – Call to Action, Tech Supplement, June 2014) http://www.norcalwater.org/groundwater-technicalsupplement/
10. What form of banking is an agricultural systems approach? Direct percolation … but possibly not in the form we might first envision.
11. UC Davis groundwater banking project teamHelen E. Dahlke, Asst. Prof. in Integrated Hydrologic Sciences, UC DavisThomas Harter, Prof. and CE Specialist in Groundwater Hydrology, UC DavisSteve Orloff, CE County Director and Farm Advisor, Siskiyou CountyDaniel Putnam, CE Agronomist and Forage Specialist, UC DavisSamuel Sandoval Solis, Asst. Prof. and CE Specialist in Water Management, UC Davis Daniele Zaccaria, Asst. Prof. and CE Specialist in Agricultural Water Management, UC DavisToby O’Geen, Prof. and CE Soil Resources Specialist, UC DavisJosué Medellín-Azuara, Professional Researcher in Hydro-economic modeling, UC DavisMark Lundy, CE Agronomy Advisor, Colusa CountyAllan Fulton, CE Irrigation and Water Resources Advisor, Tehama County
12. Figure: Faunt, 2009, p. 22??Surface water source and conveyance“Clean” recharge and effective retentionSuitable cropping systemCost-benefit, legal constraints Feasibility study of agricultural groundwater banking
13. Begin with emphasis on agricultural systems growing alfalfa and irrigated pasture. Why?Large acreage in CA (~ 1.5 million acres) higher probability to find land parcels with the right soils and suitable groundwater aquifers for bankingRelatively low use of fertilizers, pesticides low risk for leachingFlood irrigation with surface water more common suitable conveyance system for bankingPreliminary assessment suggests Costs/Benefits more favorable than other cropsBut we are also interested in other annual low-value, low-nutrient crops and possibly tree crops
14. Commitment from two water/irrigation districtsScott Valley Irrigation DistrictOrland-Artois Water District (OAWD)Potential interestLower Tule River ID and Pixley IDTulare ID Mono County Resource Conservation DistrictMadera IDCurrent status of project?
15. Scott ValleyScott Valley
16. Field level recharge study
17. Glenn County, Target Work Area - Groundwater elevation change from Spring 2004 through Spring 2014
18. Assess site specific feasibility for groundwater banking based on a farm’s soils, climatic, water supply and water-infrastructureEstimate production risks with flooding specific cropsProvide crop-specific and soil-landscape specific management guidelines to minimize risk to crop while banking groundwaterGive a holistic estimate of on-farm costs of groundwater banking: costs associated with yield, reduction in crop quality, water, labor, permits, and other management practices)Outcomes: web-based decision support tools to:
19. Thank you! Questions?
20.
21. Soil characteristics:Hydraulic conductivityOccurrence of water restrictive layers, Topographic Limitations (slope), Chemical Limitations (EC), Surface Condition (e.g. erodibility) Which soils are suitable
22. Alfalfa flooding tolerance study – UC Davis FarmTest 2 different water application durations at 3 different times during winter season (3 x 2 + 1 control)Measure plant parameters:initial stand density, vigor, stem count, yieldMeasure physical parameters: Soil moisture, soil, air, water temperature, redox potential, control volume470 ft70 ft7 treatments7 treatments7 treatments
23. May 2014Aug 2014Nov 2013Aug 2013Signs of a 3-year drought – NOAA drought indexJan 2014Dec 2014Total Annual Precipitation: 2013 – Driest year to dateAnnual average temperature: 2014 – 3rd warmest year
24. Prerequisite work in OAWDGIS analysis:Land use (1993-2014)Water infrastructure (digitized)Soil suitability index for groundwater banking Groundwater level dataSurface water availability:Analysis of annual and daily historic stream flow data Constraint - capacityModeling:CVHM – development of groundwater depressionbased on historic land use and water use data (change in GW level and pump rate)
25. Timeline/Tasks – August 1, 2014 – July 31, 20172014/15Identify cooperators and field sites.Complete water balance for study areasDevelop flood/storm water availability indexDevelop and calibrate groundwater model with historic data2015/16Perform crop flooding experimentsDevelop land and crop suitability indices for flooding/bankingApply groundwater model to simulate larger scale potential for bankingPerform farm economic analysis2016/17Wrap up flooding experimentsFinish large scale modeling and assessment of banking potentialAvail web-based decision support toolsProvide stakeholder workshopsPublish findings and experience
26. Historic Snowpack trendsTrend: 0.92 °C/decade
27. Surface water supplies
28. What is the proposed work?jConduct water balance analysis to estimate current and future water supply/demand, availability and amount of water needed to stabilize water reliability Identify potential groundwater banking sites through GIS analysis of land use, soils, geology, groundwater levels, irrigation practices, and existing drainages and canals Estimate surface water surplus frequency and magnitude for bankingSurface water-groundwater modeling estimate storage capacity, specific and safe yield, recovery and contaminant transport potentialOn-farm experiments Soils and hydrologic investigationsCrop suitability for groundwater bankingDemonstrating feasible BMPs to groundwater banking Cost-benefit analysis based on existing agricultural systems, water infrastructure, and institutional constraints