
Using a simple input statement to read in a flat ASCII file where there is one record per case 1 indicates checked box and missing indicates unchecked box then running freqs ID: 941092
Download Pdf The PPT/PDF document "The Use of Formats Concatenate and Sum f..." is the property of its rightful owner. Permission is granted to download and print the materials on this web site for personal, non-commercial use only, and to display it on your personal computer provided you do not modify the materials and that you retain all copyright notices contained in the materials. By downloading content from our website, you accept the terms of this agreement.


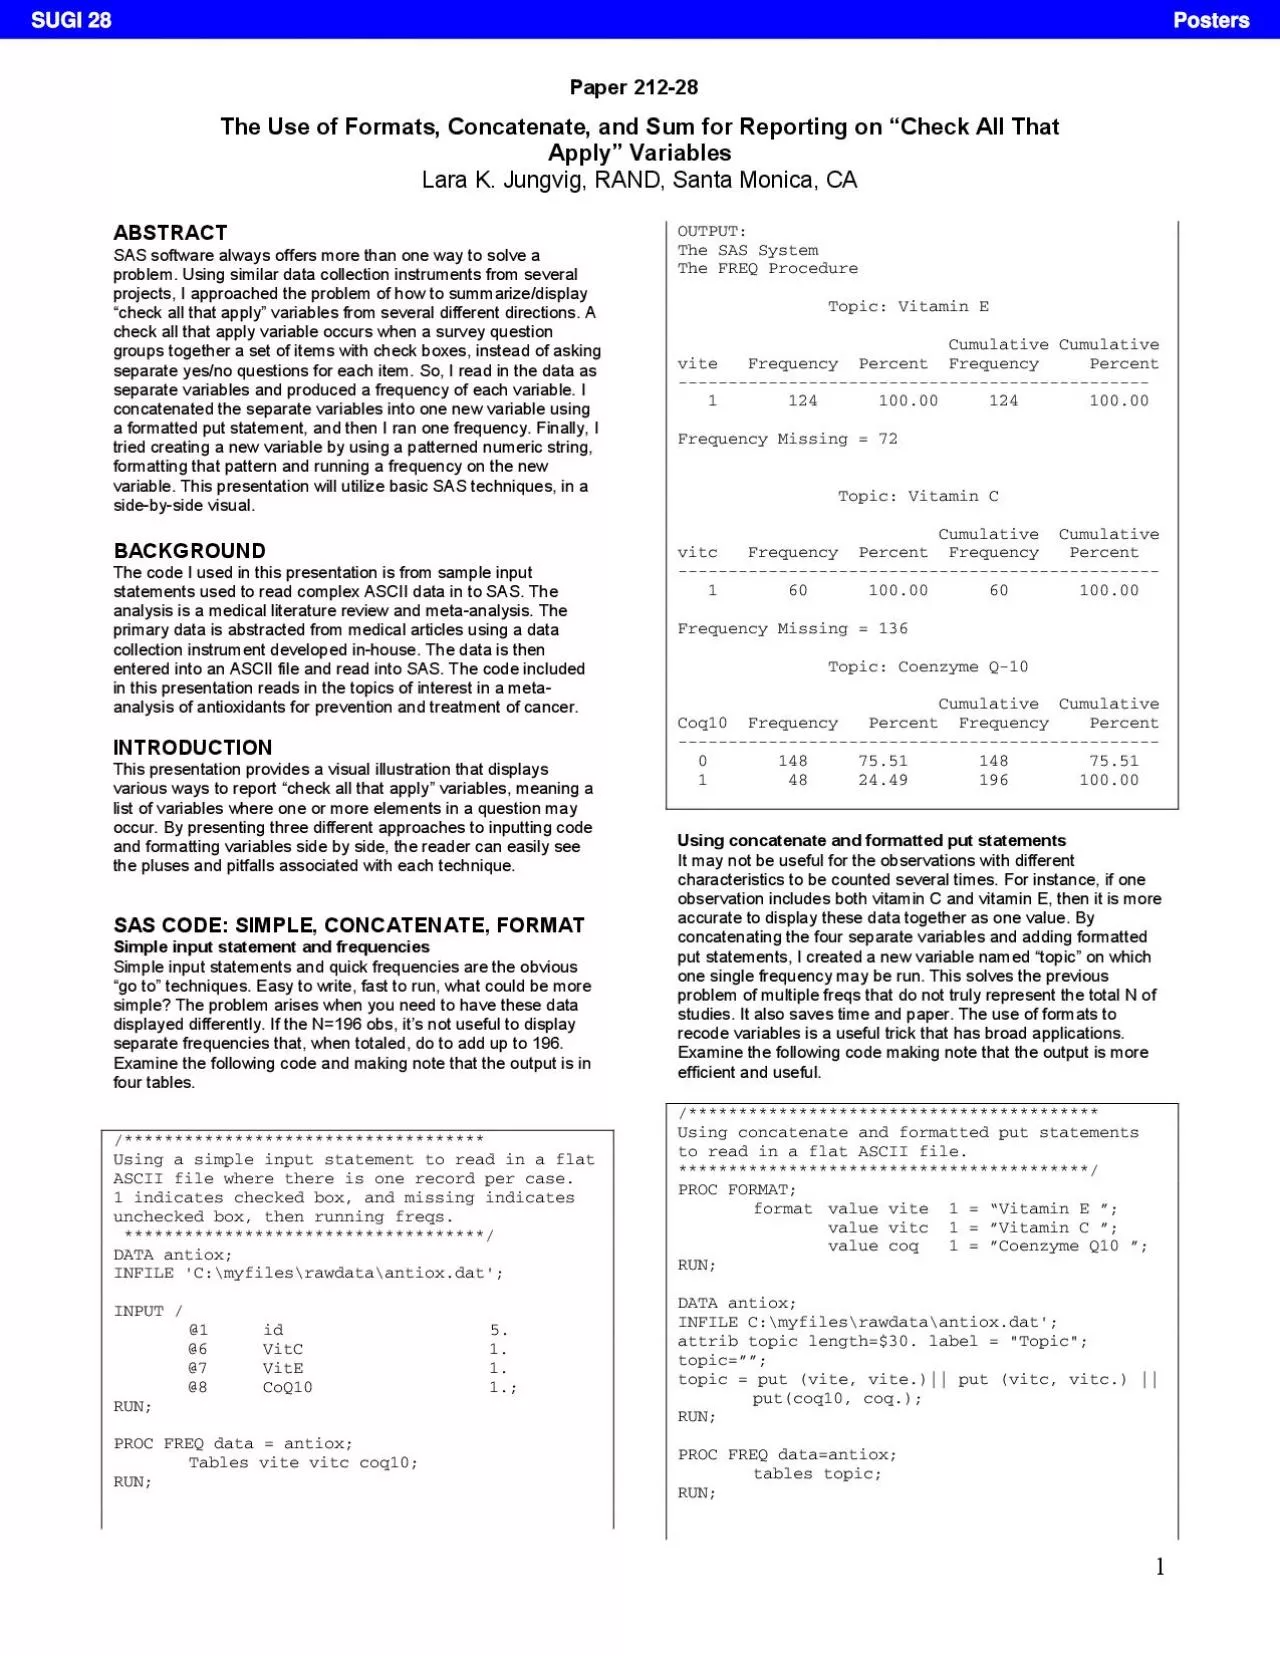
The Use of Formats, Concatenate, and Sum for Reporting on “Check All That Apply” VariablesLara K. Jungvig, RAND, Santa Monica, CA ABSTRACT SAS software always offers more than one way to solve a problem. Using similar data collection instruments from several projects, I approached the problem of how to summarize/display “check all that apply” variables from several different directions. A check all that apply variable occurs when a survey question Using a simple input statement to read in a flat ASCII file where there is one record per case. 1 indicates checked box, and missing indicates unchecked box, then running freqs. ************************************/ DATA antiox; INFILE 'C:\myfiles\rawdata\antiox.dat'; INPUT / @1 id 5. @6 VitC 1. @7 VitE 1. @8 CoQ10 1.; Tables vite vitc coq10; RUN; OUTPUT: The SAS System The FREQ Procedure Topic: Vitamin E Cumulative Cumulative Using concatenate and formatted put statements It may not be useful for the observations with different characteristics to be counted several times. For instance, if one observation includes both vitamin C and vitamin E, then it is more Using concatenate and formatted put statements to read in a flat ASCII file. *****************************************/ PROC FORMAT; format value vitc 1 = ”Vitamin C ”; value coq 1 = ”Coenzyme Q10 ”; DATA antiox; INFILE C:\myfiles\rawdata\antiox.dat'; attrib topic length=$30. label = "Topic"; topic=””; put(coq10, coq.); tables topic; RUN; SUGI 28Posters 2 OUTPUT: The FREQ Procedure topic Frequency Frequency ----------------------------------------------- Using Sum to make a pattern variable The previous example offered a better tool for data presentation, however the output could be easier to read. In the next example, I create a data display that is more useful than the first example and looks better than the second example. I utilized the sum function with max to create a pattern variable that I formatted so that the output is easily read. I added punctuation to the format, too. The sum function adds up the value for each separate variable that I multiplied by 100, 10, or 1 to create a pattern variable based on binary numbers. This ensures distinct values. The max function takes the maximum v
alue from the list of arguments. Examine the following code noting the use of the pattern to format the variable “topic”. Using Sum, Max and Formats to create and display a pattern variable. *****************************************/ value topic 1 = 'Co-Q10' 10 = 'Vitamin E' 11 = 'Vitamin E and Co-Q10' 100 = 'Vitamin C' 110 = 'Vitamin C and Vitamin E' 111 = 'Vitamin C, Vitamin E and Co-Q10' RUN; DATA antiox; INFILE 'C:\myfiles\rawdata\antiox.dat'; attrib topic label = "Topic"; topic = sum (max (0,vitc*100), max(0,vite*10), max(0,coq10)); RUN; tables topic; format topic topic.; The FREQ Procedure Cumulative topic Frequency Frequency Vitamin E 82 134 V itamin C 20 156 V itamin C and Vitamin E 39 195 Vitamin C, Vitamin E and Co-Q10 1 196 In summary, there are different ways to handle the same problem in SAS. While trying to make usable data output, I came across several techniques to handle variables that come from a “check all the apply” question on a survey. Simple freqs of each variable were not helpful in understanding the data. Concatenating those variables and using formatted put statements and running a freq on the new variable produced better data for the research team. One step further was needed, though, to produce output that was easier to read and more professional looking. By using the SUM function with MAX and formatting the pattern variable that was created, the output was ready for analysis. Each technique presented here has advantages and disadvantages. I encourage programmers to try different approaches and to incorporate new techniques in their work. REFERENCES 1. SAS® Institute Inc. (1999). “SAS OnlineDoc Version 8,” SAS® Institute Inc., Cary, NC. 2. Delwiche, Lora D. and Susan J. Slaughter (1996). “The Little SAS® Book,” SAS® Institute, Inc., Cary, NC. ACKNOWLEDGEMENTS I would like to thank Beth Roth and Mark Totten for their help on this poster. CONTACT INFORMATIONLara K. Jungvig Programmer/Analyst RAND Corporation 1700 Main Street Santa Monica, CA 90407 Phone: (310) 393-0411 Fax: (310) 451-7059 E-mail: Jungvig@rand.org SUGI 28Poster