

http wwwyoutubecomwatchvxDIyAOBayU The Standard Normal Distribution 1 Notice that the x axis is standard scores also called z scores This means that the distribution has a ID: 136642
Download Presentation The PPT/PDF document "Normal distribution demo:" is the property of its rightful owner. Permission is granted to download and print the materials on this web site for personal, non-commercial use only, and to display it on your personal computer provided you do not modify the materials and that you retain all copyright notices contained in the materials. By downloading content from our website, you accept the terms of this agreement.


Slide1
http://www.youtube.com/watch?v=xDIyAOBa_yU
The Standard Normal Distribution
Note
:
This file is on my webpage for this course. See the syllabus for the web address.Slide2
Notice that the x axis is
standard scores, also called
z scores
. This means that the distribution has a population mean of zero, and a population standard deviation of 1.Slide3
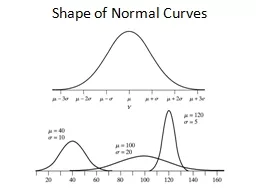
The most significant thing about the normal distribution is that
predictable proportions of cases occur in specific regions of the curve.
50%
50%Slide4
Notice that: (1) 34.13% of the scores lie between the mean and 1
sd above the mean, (2) 13.6% of the scores lie between 1 sd
above the mean and 2
sds above the mean, (3) 2.14% of the scores lie between 2 sds
above the mean and 3
sds
above the mean, and (4) 0.1% of the scores in the entire region above 3
sds
.
The curve is symmetrical,
so the area
betw
0 and -1 = 34.13%, -1 to -2 = 13.6%, etc. Also, 50% of the cases are above 0, 50% below.Slide5
IQ Percentile Problem 1
:
IQ:
m=100, s=15.
Convert an IQ score of
115
into a percentile, using the standard normal distribution.
Step 1:
Convert IQ=115 into a z score:
z = x
i
-
m
/
s
= (115-100)/15 = 15/15; z = +1.0
(1
sd above the mean)
IQ=115, z = 1.0Slide6
Step 2:
Calculate the area under the curve for all scores below z=1
(percentile=% of scores falling
below a score).
Area under the curve below z=1.0: 34.13+50.00=
84.13.
We get this by adding 34.13
(the area between the mean and z=1)
to 50.00
(50% is the area under the curve for values less than zero; i.e., the entire left side of the bell curve)
. So, an IQ score of 115 (z=1.0) has a percentile score of
84.13.
IQ=115, z = +1.0
The part with the
slanty
lines
repre-sents
the portion of the distribution we’re looking for.Slide7
IQ Percentile Problem 2
:
IQ:
m=100, s=15.
Convert an IQ score of
85
into a percentile, using the standard normal distribution.
Step 1:
Convert IQ=85 into a z score:
z = x
i
-
m
/
s
= (85-100)/15 = -15/15; z = -1.0
(1
sd below
the mean)
IQ=85, z = -1.0Slide8
Step 2:
Calculate the area under the curve for all scores below z=-1.
Area under the curve values below z=-1.0: 50.00-34.13=
15.87. We get this by subtracting 34.13 (the area between the mean and z=-1)
from 50.00
(50% is the total area under the curve for values
less than zero
; i.e., the entire left side of the bell curve)
. So, an IQ score of 85 (z=-1.0) has a percentile score of
15.87.
IQ=85, z = -1.0Slide9
z = x
i-m/
s =
85-100/15 = -15/15z = -1.0
Area under the curve for z=-1.0: 50.00-34.13=
15.87
.
We get this by subtracting 34.13 from 50.00
(50.00 is the total area under the curve for values less than zero; i.e., the entire left side of the bell curve.)
We therefore want the 50% minus the area between zero and -1.0). So, an IQ score of 85 has a percentile score of
15.87.
IQ=85, z=-1.0