
Represent traits that are either derived or lost due to evolution definitions evolutionary history of a species or group of species discipline focused on classifying organisms amp determining their evolutionary relationships ID: 615393
Download Presentation The PPT/PDF document "PHYOGENY & THE Tree of life" is the property of its rightful owner. Permission is granted to download and print the materials on this web site for personal, non-commercial use only, and to display it on your personal computer provided you do not modify the materials and that you retain all copyright notices contained in the materials. By downloading content from our website, you accept the terms of this agreement.


Slide1
PHYOGENY & THE Tree of life
Represent traits that are either derived or lost due to evolution Slide2
definitions
evolutionary history of a species or group of species
discipline focused on classifying organisms & determining their evolutionary relationships
Phylogeny
SystematicsSlide3
Taxonomy
how organisms are classified and named
each step called a
taxon
(plural: taxa)Slide4
BINOMIAL NOMENCLATURE
Man’s Genus species:
Homo sapiens
used to avoid ambiguity
the Latin scientific name for each individual species
is the
Genus species portion of taxonomySlide5
3 DOMAINS
DOMAIN ARCHAEA
Prokaryotes
many live in Earth’s extreme environments
as molecularly close to eukaryotes as Domain Bacteria
includes multiple kingdomsSlide6
(notice position of domain
Archaea
)Slide7
Domain Archaea
methanogen
thermophileSlide8
Domain Bacteria
Prokaryotic
very diverse group
use every major mode of nutrition & metabolism
beneficial: photoautotrophs, alcoholic fermentation, Vit K productionpathologic: strep throat, flesh-eating disease, ulcers, Rheumatic feverSlide9
Domain Bacteria
Gram Positive Bacteria
Streptococcus
(cocci)
Gram Negative BacteriaLegionella
pneumophilia(rods)Slide10
Domain Bacteria
Spirochetes
(
spirillia
)Slide11
Domain Eukarya
Eukaryotic cells
more complex, become specialized
able to form multicellular organisms
greatest diversitySlide12
Domain Eukarya
Plants
FungiSlide13
Domain Eukarya
Animal
ProtozoaSlide14
Domain Eukarya
Algae Cells
Algal “bloom”Slide15
Linnean ClassificationSlide16
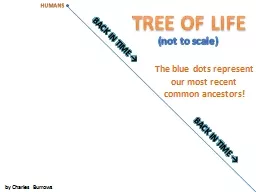
PHYLOGENETIC TREES
show the evolutionary history of a group of organisms
represented by a branching diagram
each branch point represents the divergence of 2 evolutionary lineages from a common ancestor
Representation to show that speciation has occurred Slide17
Phylogenetic Trees
Branch Point
relatedness of any two groups is shown by how recently two groups has a common ancestorSlide18
What you can learn
What you cannot learn
patterns of descent
common ancestors
does not show phenotypic similarity
cannot tell ages of species based on where branches are in the “tree”
sister taxa
did not evolve from each other; they have a common ancestor (that could be extinct)
Phylogenetic
TreesSlide19
Uses of Phylogenetic Tree
If “close” relatives found they could be source of beneficial alleles that could be transferred to hardier taxa via genetic engineering
2.
Using DNA samples are now able to differentiate legal species from illegal species of whale, tunaSlide20
Phylogenies are inferred from morphological & molecular data
Homology
: similarity in characteristics resulting from a shared ancestrySlide21
Homologous Chromosomes in same species
When chromosomes duplicate in S Phase of Cell Cycle see genes in same loci of each sister chromatidSlide22
Homologous Chromosomes across Species with Common Ancestor
Genes or certain DNA sequences also homologous if they descended from sequences carried by a common ancestorSlide23
Organisms that share very similar morphologies or DNA sequences are likely to be more closely related than organisms with vastly different structures
There are examples of organisms that look very different but have very similar DNA sequences because species underwent adaptive radiation.Slide24
Homology vs. Analogy
Analogy is similarity due to convergent evolution: occurs when similar environmental pressures & natural selection produce similar (analogous) adaptations even though organisms have different ancestors.Slide25
The more complex the structure found in 2 species the more likely it is that they have a shared ancestorSlide26
Molecular Evidence
of Evolutionary Relationships
DNA sequence similarities have been documented among prokaryotes & eukaryotes: (comparative genomics)
High degree of sequence similarity noted in some eukaryotic nuclear genes to Archaea & mitochondrial genes are similar to BacteriaSlide27
Using DNA to map an organism’s evolutionary history
The more recently 2 species have branched from a common ancestor, the more similar their DNA sequences should be
The longer ago 2 species have been on separate evolutionary paths, the more their DNA should have divergedSlide28
Review:
Phylogeny can be inferred from
–the fossil record,
–morphological homologies
–molecular homologiesSlide29
Phylogenetic Trees vs. Cladograms
A phylogenetic tree represents the evolutionary relationships among a set of organisms or groups of organisms, called taxa.
The tips of the tree represent groups of descendent taxa (often species) and the nodes on the tree represent the common ancestors of those descendants.
Two descendents that split from the same node are called sister groups.
Evolutionary trees depict cladesa group of organisms that includes an ancestor and all
descendants of that ancestor; Shared ancestral characters group organismsYou can think of a clade as a branch on the tree of life. Slide30
character that originated in an ancestor of the taxon
an evolutionary novelty unique to a clade.
Shared Ancestral Character
Shared Derived CharacterSlide31
Shared Ancestral Character
Shared Derived CharacterSlide32
How to Build a Cladogram
http://ccl.northwestern.edu/simevolution/obonu/cladograms/Open-This-File.swfSlide33
How to Construct a Phylogenetic TreeSlide34
Making a Phylogenetic Tree
SHOULD BE POSSIBLE TO DETERMINE THE CLADE ANY SHARED DERIVED CHARACTER 1
ST
APPEARED
Construct a CHARACTER TABLE:1 axis has list of organisms, 1 has charactersSlide35
CHARACTER TABLE
FROG
IGUANA
DUCK-BILLED PLATYPUS
KANGAROO
BEAVERAMNION
HAIR, MAMMARY GLANDS
GESTATION
LONG GESTATIONSlide36
Important step in cladistics is the comparison of the
Ingroup
: the taxa whose phylogeny is being investigated
Outgroup:
the taxon that diverged before the lineage leading to the members of the ingroup
Use to identify the derived characters that define the branch points in the phylogeny of the ingroupSlide37
PHYLOGENETIC TREES
WHEN CONSTRUCTING A PHYLOGENETIC TREE, SCIENTISTS USE
PARSIMONY
, LOOKING FOR THE SIMPLEST EXPLANATION FOR OBSERVED PHENOMENASlide38
SYSTEMATISTS USE MANY KINDS OF EVIDENCE, BUT EVEN THE BEST TREE REPRESENTS ONLY THE MOST LIKELY HYPOTHESISSlide39
Shared characters are used to construct
phylogenetic
trees
The phylogenetic tree of reptiles shows that crocodiians are the closest living relatives of birds