

DataTitle Larry C Shubat Professor The University of Akron Ohio GIS Conference Hyatt Regency Columbus September 24 26 2018 Columbus Ohio Prof Shubat BIO 2 BA Geology UC Davis CA ID: 731102
Download Presentation The PPT/PDF document "Understanding Vector and Raster" is the property of its rightful owner. Permission is granted to download and print the materials on this web site for personal, non-commercial use only, and to display it on your personal computer provided you do not modify the materials and that you retain all copyright notices contained in the materials. By downloading content from our website, you accept the terms of this agreement.


Slide1
Understanding Vector and Raster DataTitle
Larry C. ShubatProfessorThe University of Akron
Ohio GIS Conference
Hyatt Regency Columbus
September 24 – 26, 2018
Columbus, OhioSlide2
Prof Shubat BIO
2BA Geology UC Davis, CA 1976US Army Officer (Corps Engineers) 1977 - 1997MS Geodesy Ohio State Univ 1985 -1987Defense Mapping Agency (NGA) 1987- 1990Retired Army 1997 UA ROTC 1997UA Surveying and Mapping Program/GIS
2001 -Faculty PresentMS Geography/GIS The Univ of Akron 2005GIS/LIS Program Director 2011Slide3
Ohio GIS Conference Sept 20183Slide4
Understanding your DATAMany learn their GIS skills in their work environment.MISSING FULL ACADEMIC DISCIPLINEUnderstandingCartographyGeodesy
Coordinate SystemsMap ProjectionsPhotogrammetry – coming back - DronesNEW DATUM (USGS) 2022NEW OHIO: County Low Distortion Projections ?? 4Slide5
GIS ACRONYM forGeographicInformation
SystemGISc: Geographic Information ScienceGeospatial TechnologySpatial ITINFORMATION AGE TO GEOSPATIAL AGE !!Slide6
Data Models Data StructuresData FormatsUNDERSTAND GIS DATAFirst Step: Understand these wordsSlide7
HOW DO WE REPRESENT REALITY?Vector Data ModelRaster Data Model
Attribute Tables – Power of GISData Model ConceptSlide8
Capture World in Digital FormatSlide9
Vector – DATA CHARACTERISTICS1ST CHARACTERISTIC: SPATIAL LOCATION Points - exact spacial location or
spatial coordinate (Geodesy) Datums Coordination Systems Projections Lines – sequence of connecting points with order and direction (topology) Polygons or areas – connected lines that close (have area) New HZ VT Datum 2022Slide10
VECTOR DATA 2ND CHARACTERISTICS OF GIS DATA DIMENSIONALITY POINT DIMENTION 0 EXISTS
LINE DIMENTION 1 LENGTH POLYGON DIMENTION 2 LENGTH WIDTHWHAT’S NEXT?? VOLUME 3 + HEIGHT 10Slide11
DIMENTIONALITYNEXT: 4TH DIMENTION WHAT IS IT??TIME: 4TH DIMENTION
Temporal data specifically refers to times or dates, enabling temporal visualization and ultimately temporal analysis.ALWAYS DATE YOUR WORK/DATA - Name/Date11Slide12
3ND CHARASTERISTIC OF DATALEVELS OF MEASUREMENTNOMINAL - NameORDINAL - Order/RankingINTERVAL - Relative Scale Elevation
RATIO - Absolute Scale RF, Kelvin12Getting Started with GIS Keith C. ClarkSlide13
13Slide14
Other: CharacteristicsCONTINUITY – CONTINUOUS DATA?ELEVATIONTEMPERATUREDISCRETE DATA?SOILGEOLOGY
14Slide15
Basic properties of geographic features
Figure 2.20 Basic properties of geographic features Getting Started with GIS Keith C. ClarkSlide16
Data Structures(CONCEPT)
Data in the Form the computer can useNormally in TABLES!!Programmers DomainSlide17
Vector Structure Development(On EXAM)Unstructured or Cartographic Spaghetti
First generation – just tables and coordinatesArc/Node Structure – Hierarchical in nature Each feature type consists of the next fewer dimensions = polygons consist of lines, and lines consist of points, and points have exact spatial location.Topology – Elegant new structure bases on relationships and continuitySlide18
DATA FORMATSHow the data is physically saved.TURN ON EXTENSIONS
Uncheck BoxSlide19
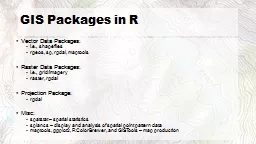
Vector FormatsCommon Vector FormatsShapefile xxx.shp extension is how it is physically saved so the computer can read it.
Think of saving a word document xxx.docxGeodatabase format = xxx.gdb = file gdbSlide20
RASTER DATA (Model and Structure Same)Generic structure for a grid
Getting Started with GIS Keith C. ClarkSlide21
Raster FormatsMost raster formats are digital image formatsMost GIS’ accept TIF, GIF, JPEG, JP2000, xxxxDEM’s are true raster data formatsDigital Elevation Model
Think of your digital camera = xxx.jpg formatNew Formats OutSlide22
Where to find information about the Data?Metadata = Is data about dataAccuracy, date, source, coordinate system, projection, datum, etcSlide23
Where To Find MetadataAlways look at basic metadata at least once when you get a new data set in. Just like a topographic map – always read the marginal information first to understand the map!!Take the time to look at both Vector and Raster metadata
23Slide24
Vector Metadata Data1. Quick look:Rt Click LayersData PropertiesSource Tab
Look at Path of Data!24Slide25
Vector Metadata BASE COORDINATE SYSTEM OF DATA 1. Quick look:Rt Click LayersData PropertiesSource TabScroll Down
Change from NAD 83 WGS 84Next?? 202225Slide26
Vector Metadata1. Quick look:Rt Click LayersData Frame PropertiesFirst Data Set added=
Data Frame Properties!26Slide27
Vector MetadataData ArcCatalog1. FULL look:
27Slide28
28Slide29
RASTER METADATA - HARD TO FINDRt Click Data – Layer PropertiesExplore All – Source Tab
29UndefinedSlide30
30Slide31
Data ModelsData StructuresData FormatsUnderstand these termsSlide32
FOCUS ON SPATIAL DATAFirst thing I emphasize in GIS:UNDERSTAND YOUR DATA &
UNDERSTAND WHAT THE SOFTWARE IS DOING TO YOUR DATA32Slide33
JOIN VS RELATE (1 to Many)
33JOIN: 1 to 1CardinalityBrings over only 1st Common Field of data.Attributes case sensitive!!Must export to save Join.Slide34
How to turn an excel spatial spreadsheet into a shapefile.Add Data
Rt Click on excel – OpenDisplay XY - Tricky – must know Coord SystemExport to ShapefileSTUDENTS REALLY LEARN/ UNDERSTAND ATTRIBUTE TABLES.34Slide35
QuestionsSURVEYING & MAPPING / GISSlide36
UNIV AKRON NEWS University of Akron shedding 80 degree programsMasters Geography/GISBS Geography/GISAssociate Geographic and Land Information Systems (GIS/LIS)
GIS CLASSES STILL TAUGHTSlide37
History of GIS
QUESTIONS